This is the mobile-friendly web version of the original article.

U.S. DEPARTMENT OF ENERGY
Office of
ENERGY EFFICIENCY & RENEWABLE ENERGY
National Plug-In Electric Vehicle Infrastructure Analysis
September 2017
- Authors
- Acknowledgments
- List of Acronyms
- Executive Summary
- Table of Content
- List of Figures
- List of Tables
Authors
Eric Wood, Clément Rames, Matteo Muratori, Sesha Raghavan, and Marc Melaina National Renewable Energy Laboratory
Acknowledgments
This study was supported by the U.S. Department of Energy’s Vehicle Technologies Office. The authors would specifically like to thank Michael Berube, Sarah Olexsak, Jacob Ward, Rachael Nealer, and David Gohlke for their guidance and support. Additional thanks to Jarett Zuboy for insightful suggestions and contributions during the internal writing and editing process, to Julia Thomas and Stephanie Price for providing timely and thorough reviews, and to Ted Kwasnik for support with geographic information systems
Special thanks to those who contributed reviews during various phases of the work, including:
• Nick Nigro (Atlas Public Policy)
• Kadir Bedir (California Energy Commission)
• Tyler Svitak (City and County of Denver)
• Marcus Alexander (Electric Power Research Institute)
• Wayne Killen (Electrify America)
• Michael Tamor (Ford Motor Company)
• Britta Gross (General Motors)
• Matthew Goetz (Georgetown Climate Center)
• Michael Nicholas (International Council on Clean Transportation)
• Kathy Kinsey (Northeast States for Coordinated Air Use Management)
• Ralph Troute (Sacramento Municipal Utility District)
• Don MacKenzie (University of Washington)
• Susan Burke, Meredith Cleveland (U.S. Environmental Protection Agency)
• Michael Scarpino, Diane Turchetta, John Davies, Tianjia Tang (U.S. Federal Highway Administration)
List of Acronyms
BEV battery electric vehicle
BEVxxx battery electric vehicle with an electric range of xxx miles
DC direct current
DCFC direct current fast charging
DOE U.S. Department of Energy
DOT U.S. Department of Transportation
EV electric vehicle
EVI-Pro Electric Vehicle Infrastructure Projection Tool
eVMT electric vehicle miles traveled
EVSE electric vehicle supply equipment
FHWA U.S. Federal Highway Administration
HEV hybrid electric vehicle
HPMS Highway Performance Monitoring System
INL Idaho National Laboratory
L2 level 2 (charging station)
LDT long-distance trip
LDV light-duty vehicle
MUD multiple-unit dwelling
NHTS National Household Travel Survey
NREL National Renewable Energy Laboratory
PEV plug-in electric vehicle (BEV or PHEV)
PHEV plug-in hybrid electric vehicle
PHEVxx plug-in hybrid electric vehicle with an electric range of xx miles
SHRP2 NDS Second Strategic Highway Research Program’s Naturalistic Driving Study
SUV sport utility vehicle
TAF Traveler Analysis Framework
VMT vehicle miles traveled
ZEV zero-emission vehicle
Executive Summary
This report addresses the fundamental question of how much plug-in electric vehicle (PEV) charging infrastructure—also known as electric vehicle supply equipment (EVSE)—is needed in the United States to support both plug-in hybrid electric vehicles (PHEVs) and battery electric vehicles (BEVs). It complements ongoing EVSE initiatives by providing a comprehensive analysis of national PEV charging infrastructure requirements. The result is a quantitative estimate for a U.S. network of non-residential (public and workplace) EVSE that would be needed to support broader PEV adoption. The analysis provides guidance to public and private stakeholders who are seeking to provide nationwide charging coverage, improve the EVSE business case by maximizing station utilization, and promote effective use of private/public infrastructure investments.
The analysis is organized around the non-residential EVSE network required to meet consumer coverage expectations and to satisfy consumer demand in high-PEV-adoption scenarios. Coverage and charging demand estimates needed to serve growing PEV markets are made for the communities where people live and the highway corridors on which they travel (Figure ES-1), including four specific geographic areas:
- Cities (486 Census Urban Areas, population greater than 50,000, 71% of U.S. population)
- Towns (3,087 Census Urban Clusters, population 2,500 to 50,000, 10% of U.S. population)
- Rural Areas (regions not covered by Census Urban Areas/Clusters, 19% of U.S. population)
- Interstate Highway System Corridors (28,530 miles of highway).
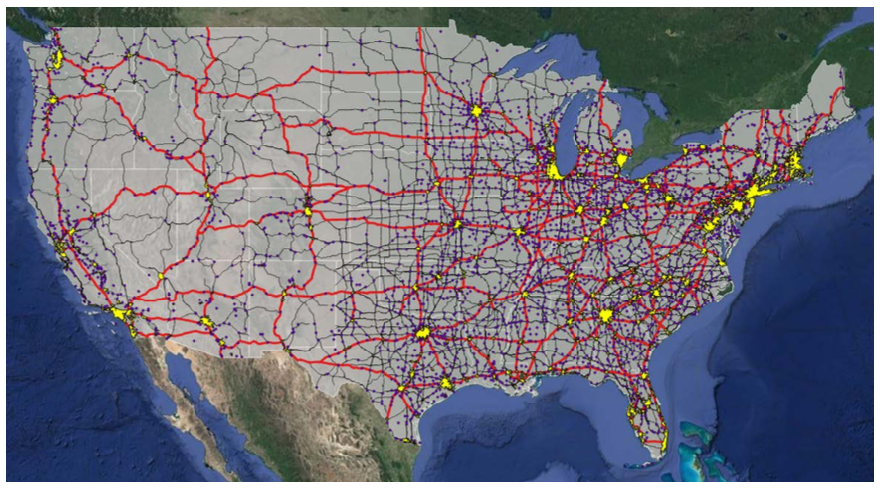 Figure ES-1. Cities (yellow polygons), towns (purple points), and interstates (thick red lines) considered in this analysis.
(Satellite imagery credit: © 2017 Google, Map Data © 2017 Tele Atlas)
While this work is not intended to forecast future PEV markets, scenarios are developed to exercise the infrastructure estimation methodology and highlight sensitivities. The analysis assigns no probabilities to any PEV market or technology scenarios and considers none of the scenarios as most likely. However, a central scenario is established from which individual elements of the modeling framework are studied using parametric sensitivity analysis as shown in Table ES-1. The central scenario and bounds on the accompanying sensitivities have been developed using a combination of existing PEV market/technology data and engineering judgement to represent a set of scenarios that are illustrative of the role that key variables play in dictating PEV infrastructure requirements. The goal of this scenario development is to estimate the magnitude of PEV infrastructure requirements (relative to a growing national fleet of PEVs) and to highlight dependencies with consumer preferences and technology development.
Table ES-1. PEV Market Conditions for the Central Scenario and Sensitivities Explored 
BEVxxx = battery electric vehicle with a range of xxx miles
DCFC = direct current fast charging
eVMT = electric vehicle miles traveled
kW = kilowatt
LDV = light-duty vehicle
PHEV = plug-in hybrid electric vehicle
PHEVxxx = plug-in hybrid electric vehicle with a range of xxx miles
SUV = sport utility vehicle
The analysis relies on advanced PEV simulations using millions of miles of real-world daily driving schedules sourced from large public and commercial travel data sets. Technical considerations are made for the spatial density of PEVs concentrated in cities and towns, ambient temperature effects on electric driving range, and frequency of long distance driving days requiring non-residential EVSE. Simulations are rooted in a set of foundational assumptions which are applied across all scenarios. For example, consumers are simulated in all scenarios as preferring to perform the majority of charging at their home location. This assumption produces simulation results in the central scenario where 88% of PEV charging takes place at home locations (due to the large amount of time vehicles are parked at home and relatively short typical daily driving distances), consistent with early market findings in the EV Project. Charging at non-residential stations is simulated on an as-necessary basis such that consumers are able to maximize electric vehicle miles traveled (eVMT).
Additionally, it is assumed that future PEVs will be driven in a manner consistent with present day gasoline vehicles (e.g., 70% of daily driving under 40 miles and 95% under 100 miles). While impacts of transportation network companies (e.g., Uber, Lyft) and advances in automated driving technology are not considered in this analysis, interactions between evolving mobility patterns and refueling infrastructure supporting advanced vehicles are currently being investigated by the consortium of national laboratories participating in the U.S. Department of Energy’s SMART Mobility Initiative.
Analysis results for the central scenario are summarized in Table ES-2. Results are reported as numbers of direct current fast charging (DCFC) stations required to provide an acceptable level of coverage and the number of plugs required to satisfy PEV charging demand. Figure ES-2 and Figure ES-4 highlight the sensitivities of these values to the many variables explored in the analysis.
Table ES-2. Summary of Station and Plug Count Estimates for the Central Scenario (15M PEVs in 2030) 
Note: Station count estimates for providing a minimum level of coverage have been omitted for community L2 stations under the assumption that non-residential L2 is primarily used for charging within walking distance of a destination (based on the low charge power and long charge time of L2 stations) and coverage for every destination was considered unrealistic for the early PEV market (however, demand estimates for L2 plug counts are included). Similarly, coverage estimates are omitted for DCFC stations in rural areas as coverage provided by stations in cities/towns and along interstate corridors was deemed sufficient.
Non-Residential Charging for Communities
The analysis first estimates the minimum DCFC coverage requirements for dispelling range anxiety concerns by providing a safety net of DCFC stations in cities and towns for emergency situations (such as failing to overnight charge at home). To ensure that BEV drivers in cities are never more than 3 miles from a DCFC station, approximately 4,900 DCFC stations are required across the United States. Providing the same level of coverage for towns would require approximately an additional 3,200 DCFC stations.
The analysis also estimates non-residential charging stations (work and public) required to satisfy intracommunity charging demands. Figure ES-2 shows the sensitivity of total national plug requirements to several input variables. In the central scenario, a total of approximately 600,000 non-residential Level 2 (L2) plugs and 25,000 DCFC plugs are necessary to satisfy consumer charging demand (assuming 15 million PEVs are on the road in 2030).
 Figure ES-2. Effects of input variables on estimated total national plug requirements in communities.
Perhaps surprisingly, the national PEV total is not the most sensitive input parameter in this analysis; PEV electric range, commitment to maximizing PHEV eVMT, and percent of charging taking place at home have the largest effects. For instance, assuming a PEV market composed entirely of PHEV50s (PHEVs with a range of 50 miles) and BEV250s (BEVs with a range of 250 miles) (the long range preference scenario) drops nonresidential L2 requirements to approximately 338,000 plugs and public DCFC to 8,400 plugs. The sensitivity on PHEV support reveals that non-residential L2 charging is modeled almost exclusively as supporting PHEVs, where providing full support (maximizing eVMT for all PHEV owners) results in over 1,100,000 plugs, and providing no PHEV support drops the non-residential L2 plug requirement to under 63,000. Finally, the sensitivity analysis on home charging demonstrates a strong relationship between home charging utilization and non-residential infrastructure requirements. Specifically, a decrease in the amount of charging happening at residential locations from 88% in the central scenario to 82% results in charging requirements increasing to 1,100,000 non-residential L2 EVSE plugs and over 65,000 public DCFC plugs.
Fast Charging for Long-Distance Travel Corridors
Long-distance travel has been a barrier to BEV adoption due to real vehicle range limitations, which can be exacerbated by even more restrictive perceived range anxiety. Long-range BEVs have the potential to address this issue if coupled with an extensive and convenient network of DCFC stations that enable reliable intercity travel. The analysis finds that approximately 400 corridor DCFC stations (spaced 70 miles apart on average) are required to provide convenient access to BEV drivers across the U.S. Interstate System. Approximate coverage enabled by DCFC stations in this scenario is visualized in Figure ES-3 with red buffers placed around the Interstate network, each with a radius of 70 miles.
 Figure ES-3. Approximate BEV driving coverage enabled by providing DCFC stations along the U.S. Interstate System.
(Satellite imagery credit: © 2017 Google, Map Data © 2017 Tele Atlas)
Figure ES-4 shows estimated station and plug counts for corridor fast charging supporting BEV travel along the U.S. Interstate network. Results are presented using parametric sensitivity analysis highlighting the influence of four input variables: 1) network coverage, 2) average station spacing, 3) national BEV count, and 4) average DCFC charge time. For example, 408 corridor DCFC stations are necessary in the central scenario, which assumes full Interstate coverage and 70-mile average station spacing. However, corridor DCFC station counts range from 137 to 713 depending on network and station spacing. Similarly, corridor DCFC plug counts are estimated at 2,472 in the central scenario but vary from 824 to 3,709 in the parametric sensitivity analysis depending on network coverage, size of the BEV fleet, and DCFC charge times.
 Figure ES-4. Sensitivity of corridor DCFC station (left) and plug (right) counts to selected networks, station spacings, BEV counts, and DCFC charge times.
As described above, the U.S. Interstate System provides a basis for DCFC infrastructure that can efficiently satisfy long-distance driving demands in the near term. The Interstate System is not, however, entirely isolated from community-based DCFC infrastructure. Although full community-based infrastructure may take longer to establish, it could provide travel corridors with charging backup options, route flexibility, and additional coverage along U.S. highways and state routes. Figure ES-5 shows the national DCFC station coverage enabled by providing the community-based charging station coverage previously discussed. Each covered city and town has a 70-mile radius buffer around it, approximating station coverage.

Figure ES-5. Approximate BEV driving coverage enabled by providing DCFC stations in all cities and towns in the United States.
(*Satellite imagery credit: © 2017 Google, Map Data © 2017 Tele Atlas*)
Major Conclusions
This report categorizes PEV charging infrastructure requirements by area served (cities, towns, rural areas, and Interstate corridors) and role during early PEV market growth (providing coverage to early PEVs and satisfying demand due to increased PEV adoption). The analysis makes no assumptions about the likelihood of particular PEV market or technology scenarios. Rather, a range of plausible scenarios explores the relationship between the evolution of the PEV fleet and charging infrastructure.
Communities are expected to have significantly larger charging infrastructure requirements than Interstate corridors under both the coverage and demand assessments. About 4,900 DCFC stations are required across cities with an additional 3,200 DCFC stations required in towns to provide a minimum level of nationwide coverage in the communities where 81% of people live. Such a network would dampen range anxiety concerns by providing drivers with a safety net for emergency charging situations.
Intracommunity charging demand analysis demonstrates how utilization of the DCFC coverage network would be expected to grow in increased PEV adoption scenarios based on a home-dominant charging assumption. Results for a 15-million PEV market estimate a DCFC plug requirement of 25,000 in communities (approximately 3.1 plugs per average DCFC station and 3.4 plugs required to support 1,000 BEVs). Demand for non-residential L2 EVSE (including work and public charging) is estimated as 600,000 plugs necessary to support 15 million PEVs (approximately 40 plugs per 1,000 PEVs).
Sensitivity analysis of the community results for consumer charging demand indicates a strong relationship between the evolution of the PEV and EVSE markets. As this analysis attempts to arrive at charging infrastructure solutions that fill the eVMT gaps between consumer travel patterns and PEV electric ranges, infrastructure requirements are not only proportional to the total number of PEVs in the system, but also inversely proportional to PEV electric range. Manufacturer and consumer preferences with respect to electric range, charging power, and utilization of residential EVSE have direct and dramatic consequences on the level of charging demand calculated in this analysis.
Results suggest that approximately 400 corridor DCFC stations are needed to enable long-distance BEV travel along Interstate highways between cities (where the majority of BEVs are likely to be concentrated). Understanding driving patterns, vehicle characteristics, and charging behavior and then prioritizing corridors and setting station spacing accordingly—as illustrated in the network scenarios—could help optimize the utility and economics of early-market corridor charging stations.
Regardless of geographic scope, the analysis suggests that organizations planning for charging infrastructure to support consumer adoption of PEVs need to be aware of the importance of consumer preferences with respect to electric range and charging behavior. Furthermore, planners should focus on providing consumers with adequate charging coverage (particularly DCFC supporting adoption of BEVs) while monitoring station utilization over time and increasing charging capacity (both in terms of rated power and number of plugs) as the PEV market continues to grow.
Table of Content
List of Acronyms
Executive Summary
List of Figures
**List of Tables **
- 1 Introduction
- 1.1 Recent EVSE Initiatives and Analysis Studies
- 1.2 Analytic Approach
- 1.2.1 Conceptual Representation of PEV Charging Infrastructure Requirements
- 1.2.2 Scenario Discussion
- 1.2.3 Report Structure
- 2 Existing Vehicle and Infrastructure Status
- 2.1 Plug-in Electric Vehicle Market Analysis
- 2.2 Electric Vehicle Supply Equipment Availability
- 3 Non-Residential L2 and DCFC for Community Charging
- 3.1 DCFC Coverage Estimates
- 3.2 Non-Residential EVSE Community Demand Estimates
- 3.2.1 Electric Vehicle Infrastructure Projection (EVI-Pro) Tool
- 3.2.2 Estimating Non-Residential EVSE/PEV Nominal Ratios
- 3.2.3 National Results in the Central Scenario
- 3.2.4 Sensitivities of National Results to Various Assumptions
- 4 DCFCs for Corridor Charging
- 4.1 DCFC Interstate Corridor Coverage Calculations
- 4.1.1 Full Interstate Network
- 4.1.2 Corridor Prioritization
- 4.1.3 Station Spacing
- 4.2 DCFC Interstate Corridor Demand Calculations
- 4.2.1 DCFC Power Level
- 4.2.2 TAF Volumes
- 4.2.3 Results and Discussion
- 4.3 Challenges to Interstate Corridor Charging Infrastructure
- 4.3.1 Retail Land Use Availability
- 4.3.2 Existing Electrical Infrastructure: Proximity between Interstate Exits and Electrical Substations
- 4.4 Corridor Charging Support from Community-Based DCFC
- 4.1 DCFC Interstate Corridor Coverage Calculations
- 5 Conclusions
- 5.1 Major Conclusions
- 5.2 Summary of Modeling Limitations
References
Appendix A: Supplementary Statistics on Existing EVSE
Appendix B: EVSE/PEV Adjustment Factors to Account for Local Conditions
Appendix C: Central Scenario PEV/EVSE Estimates by State
- Appendix D: Long-Distance Travel Frequency from the SHRP2 NDS
List of Figures
Figure ES-1. Cities (yellow polygons), towns (purple points), and interstates (thick red lines) considered in this analysis
Figure ES-2. Effects of input variables on estimated total national plug requirements in communities
Figure ES-3. Approximate BEV driving coverage enabled by providing DCFC stations along the U.S. Interstate System. (Satellite imagery credit: © 2017 Google, Map Data © 2017 Tele Atlas)
Figure ES-4. Sensitivity of corridor DCFC station (left) and plug (right) counts to selected networks, station spacings, BEV counts, and DCFC charge times
Figure ES-5. Approximate BEV driving coverage enabled by providing DCFC stations in all cities and towns in the United States
Figure 1. PEV charging requirements evolution as a function of PEV market share
Figure 2. Distribution of all 2016 registrations of LDVs, HEVs, and PEVs in the United States by state ZEV status
Figure 3. Composition of 2016 U.S. PEV stock
Figure 4. Distribution of all 2016 registrations of LDVs, HEVs, and PEVs in the United States by area
Figure 5. Schematic for estimating community charging requirements
Figure 6. Nominal non-residential EVSE/PEV ratios (home dominant charging behavior)
Figure 7. Nominal charging load profile from EVI-Pro simulations (home dominant charging behavior)
Figure 8. Effects of input variables on estimated total national plug requirements
Figure 9. Effects of input variables on normalized national plug requirements (EVSE/PEV ratios)
Figure 10. Methodology and sensitivity schematic for corridor DCFC analysis.
Figure 11. Nationwide DCFC station counts to cover corridors as a function of station spacing for different scenarios
Figure 12. Interstate corridor network (thick red lines) considered in this analysis (70-mile radius red buffer approximates areas that would be served by the proposed DCFC network). Included for reference: yellow polygons represent cities, purple points represent towns, and thin black lines represent the national highway system
Figure 13. DCFC corridors providing coverage to intra-mega-region travel (70-mile radius yellow buffer approximates areas that would be served by the proposed DCFC network)
Figure 14. PEV Alternative Fuel Corridors as designated by DOT Alternative Fuel Corridor Map
Figure 15. DCFC corridors providing coverage as designated by the DOT Alternative Fuel Corridor Map (DOT 2017a) (70-mile radius yellow buffer approximates areas that would be served by the proposed DCFC network)
Figure 16. U.S. Interstate Highway corridors. Line thickness is proportional to HPMS average daily traffic
Figure 17. DCFC corridors providing coverage to the top 80% of HPMS annual average daily traffic (70-mile radius yellow buffer approximates areas that would be served by the proposed DCFC network)
Figure 18. TAF summary statistics
Figure 19. TAF long-distance travel origin–destination pairs by mode; only top 10% visualized here for clarity
Figure 20. Map of U.S. Census divisions
Figure 21. TAF long-distance auto passenger trip origin-destination pairs; only top 10% visualized here for clarity
Figure 22. Chord diagram generated using TAF long-distance auto passenger travel volume
Figure 23. U.S. Interstate Highway corridors. Line thickness proportional to TAF long-distance auto traffic
Figure 24. DCFC corridors providing coverage to the top 80% of the TAF long-distance auto traffic (FHWA 2013) (70-mile radius yellow buffer approximates areas that would be served by the proposed DCFC network)
Figure 25. Comparison of TAF and HPMS volumes (color scale proportional to TAF:HPMS ratio)
Figure 26. Station spacing methodology proposed in this study
Figure 27. Nationwide corridor DCFC station count versus station spacing, annual average volume
Figure 28. Plug requirement variance between stations
Figure 29. Sensitivity of corridor DCFC station and plug counts to network, station spacing, BEV count, and charge time
Figure 30. Distance between consecutive candidate retail sites
Figure 31. Highway exits color-coded by distance to the nearest electrical substation
Figure 32. National charging station coverage enabled by providing minimum DCFC station coverage (70-mile buffers placed around all cities and towns)
Figure B-1. Daily VMT cumulative distribution functions by population density, from the 2009 NHTS.
Figure B-2. Mimicking NHTS daily VMT cumulative distribution functions by population density by resampling INRIX travel data
Figure B-3. Adjustment factor: non-residential EVSE/PEV ratio as a function of population density
Figure B-4. Adjustment factor: non-residential EVSE/PEV ratio as a function of PEV concentration
Figure B-5. EVI-Pro DCFC effective charge rate model: percentage of EVSE rated power delivered as a function of charge duration and battery temperature
Figure B-6. Adjustment factor: non-residential EVSE/PEV ratio as a function of ambient temperature
Figure D-1. Cumulative distribution of daily VMT in 2009 NHTS and SHRP2 NDS
Figure D-2. Annual VMT distribution in 2009 NHTS and SHRP2 NDS
Figure D-3. Impact of annualized VMT (AVMT) on average long-distance travel frequency from SHRP2 NDS
Figure D-4. Impact of annualized VMT (AVMT) on long-distance travel frequency from SHRP2 NDS (percentile bins, frequency of 200+ mile days)
List of Tables
Table ES-1. PEV Market Conditions for the Central Scenario and Sensitivities Explored
Table ES-2. Summary of Station and Plug Count Estimates for the Central Scenario (15M PEVs in 2030)
Table 1. PEV Market Conditions for the Central Scenario and Sensitivities Explored
Table 2. Top 10 U.S. Urban Areas by PEV Stock, 2016 (IHS Markit 2017)
Table 3. EVSE Characteristic of the Top 10 U.S. Urban PEV Markets, 2017 (DOE 2017b)
Table 4. Modeled Vehicles
Table 5. Modeled Charging Infrastructure
Table 6. Central Scenario PEV and Non-Residential EVSE Estimates in 2030, Top 10 Urban Areas
Table 7. Central Scenario PEV and Non-Residential EVSE Estimates in 2030, by Community Type (with National Total)
Table 8. National DCFC Coverage Scenarios along U.S. Interstate Corridors
Table 9. Estimated National DCFC Station Counts to Cover Corridors under Different Scenarios
Table A-1. Public Charging Plugs by Network (DOE 2017b)
Table A-2. Public DCFC Plugs and Stations by Network (DOE 2017b)
Table B-1. EVI-Pro Driving Discharge Model: Relative Battery Discharge Rates as a Function of Ambient Temperature and Average Trip Speed
Table of contents
- 1 Introduction
- 2 Existing Vehicle and Infrastructure Status
- 3 Non-Residential L2 and DCFC for Community Charging
- 4 DCFCs for Corridor Charging
- 5 Conclusions
- References
- Appendix A - Supplementary Statistics on Existing EVSE
- Appendix B - EVSE/PEV Adjustment Factors to Account for Local Conditions
- Appendix C - Central Scenario PEV/EVSE Estimates by State
- Appendix D - Long-Distance Travel Frequency from the SHRP2 NDS