- APPENDIX I – CIRI FORT-TO-PORT DISRUPTION
APPENDIX I – CIRI FORT-TO-PORT DISRUPTION
Introduction
A primary objective of the JV 3.0 exercises was to understand the impact of cyber-originating disruptions on power projection. To address this objective, this appendix focuses on interactions between communications/IT systems and their impact on the Maritime Transportation System (MTS). Specifically, the report uses data sources—publicly available geographic information system (GIS) data and movement schedules provided by SDDC—to quantify the impact of cyber-originating disruptions based on known historical incidents. The incidents considered are consistent with the JV 3.0 injects, which took a gray-zone approach. The baseline behavior as well as the impact of a disruption as computed by a multicommodity network flow optimization algorithm (an extension of work by Boland et al.) was validated by interactions with stakeholders at SDDC and others.49
The fort-to-port analyses developed for these exercises extend the Port Disruptions Tool (PDT)— developed by the Critical Infrastructure Resilience Institute (CIRI)—to quantify the impact of such disruptions. Beyond the practical impact on understanding power projection, CIRI believes such analyses extend the current state of the art reflected in datasets such as Harmonized Grids of Critical Infrastructures in Europe (commonly known as “HARCI-EU”), a grid-based approach to critical infrastructure risk assessment.50
Given the increased dependence on communications/IT systems because of the pandemic, the widespread intrusion of nation-state actors into U.S. critical infrastructure systems, and civil unrest targeting such systems, the ability to model and prepare for such events is an increasingly essential capability for both government and private industry.51
49 Natashia Boland et al., “The Continuous-Time Service Network Design Problem,” Operations Research 65, issue 5 (September-October 2017): 1111–48.
50 Filipe Batista e Silva et al., “HARCI-EU, a Harmonized Gridded Dataset of Critical Infrastructures in Europe for Large-Scale Risk Assessments,” Scientific Data, 6, no. 126 (2019).
51 Natasha Veligura et al., The Impact of COVID-19 on the Global Telecommunications Industry (Washington, DC: International Finance Corporation, updated May 2020); Hannah Murphy and Demetri Sevastopulo, “US Says Cyber Hack Poses ‘Grave Risk’ to Critical Infrastructure,” Financial Times, December 17, 2020, https://www.ft.com/content/edbad243-28ed-4133-98a0-1447a7213abf; and Shane Harris, “Nashville Bombing Is a Potent Reminder That Communications Systems Remain at Risk from Attack,” Washington Post, December 28, 2020, https://www.washingtonpost.com/national-security/nashville-bombing-is-a-potent-reminder-thatcommunications-systems-remain-at-risk-from-attack/2020/12/28/d734b76c-4949-11eb-839a-cf4ba7b7c48c_story.html.
Data Sources
The table below illustrates the data sources used in the analysis.

Table 8: JV 3.0 Data Sources
Critical Infrastructure Networks
At a high level, CIRI has created a multilayered network whose layers correspond to critical infrastructure networks. This study focuses on interactions between the communications/IT sectors and their impact on the transportation sector. If desired, future work could integrate dependencies on the electrical power system, building on expertise gained via the Defense Advanced Research Projects Agency Rapid Attack Detection, Isolation and Characterization Systems at the University of Illinois at Urbana-Champaign (UIUC).52

Figure 27: A Multilayered Network Model for Critical Infrastructure
Transportation Sector: Intermodal transportation networks were directly extracted from the GIS data sources listed above. These GIS files were processed, via the NetworkX package from Los Alamos National Laboratory, into directed networks that use the L-space representation.53 In the L-space representation for transportation networks, vertices within a network correspond to locations, edges correspond to roadways/railways, etc.54 The SC railway network (DS-TR.N-4) resulting from the GIS file (DS-TR.N-3) has 2,732 nodes; this is similar in size to 2,500, the average number of nodes in railway networks provided by a 2013 survey of L-space representations for transportation networks.55 To optimize commodity flows across such a network, however, CIRI needed to reduce the size of the network. For example, the paper by Boland et al. in the transportation network optimization literature considered benchmarks for fixed graphs that were 20–30 nodes, 230–700 arcs, and 40–100 commodities.56 Therefore, we employed various approaches to reduce the size of the transportation network graphs. The approach we adopted, based on a paper by Buchsbaum and Westbrook, constructs a hierarchy tree to adaptively collapse groups of transportation network locations into a single node according to their geographic proximity to one another.57 Depending upon the degree of resolution desired for an analysis, different levels of detail in the network are preserved (including properties such as travel time and cost through a subgraph). More details about this approach can be provided by CIRI on request. Note that once this transformation occurs, the networks no longer may be considered as using an L-space representation.
Cyber Disruptions with Secondary Impacts on Power Projection
This section provides an overview of three types of cyber-originating disruptions to power projection based on real-world incidents:
Train derailment due to compromised rail-control signals
Rail delays due to communications network degradation
Traffic congestion resulting from cyberattacks
52 Walter Weiss, “Rapid Attack Detection, Isolation and Characterization Systems (RADICS),” Defense Advanced Research Projects Agency (website), n.d., https://www.darpa.mil/program/rapid-attack-detection-isolation-and-characterization-systems, accessed January 5, 2021.
53 Aric A. Hagberg, Daniel A. Schult, and Pieter J. Swart, “Exploring Network Structure, Dynamics, and Function Using NetworkX,” in Proceedings of the 7th Python in Science Conference (SciPy 2008) (self-pub., 2008), http://conference.scipy.org/proceedings/scipy2008/SciPy2008_proceedings.pdf.
54Julian Sienkiewicz and Janusz A. Hołyst, “Statistical Analysis of 22 Public Transport Networks in Poland,” Physical Review E 72, issue 4, part 2 (October 2005).
55 Jingyi Lin and Yifang Ban, “Complex Network Topology of Transportation Systems,” Transport Reviews 33, issue 6 (2013).
56 Boland et al., “Continuous-Time Service Network Design Problem,” 1111–48.
57 Adam L. Buchsbaum and Jefferey R. Westbrook, “Maintaining Hierarchical Graph Views,” in SODA ’00: Proceedings of the Eleventh Annual ACM-SIAM Symposium on Discrete Algorithms (Philadelphia: Society for Industrial and Applied Mathematics, February 2000), 566–75.
Baseline Context
The context for discussion of these disruptions is the SDDC Baseline Plan of Action and Milestones that was provided as part of the JV 3.0 exercises. The time-location diagram in figure 28 plots intermodal road and rail movements from Fort Stewart to the North Charleston Terminal used by the 841st Transportation Battalion command. Commercial line haul, convoy, and train movements over the course of the exercise time line are shown. The accompanying table presents the dates used to instantiate the diagram. Times from source to destination along optimal routes were calibrated via a combination of feedback from SDDC and Google Maps, as discussed in more detail below.

Figure 28: Intermodal Road and Rail Movements from Fort Stewart to North Charleston Terminal Used by the 841st Transportation Battalion Command.
Disruption 1 (D1): Derailment via Infrared Hack
In the JV 3.0 exercise, the MSEL included an inject on Tuesday morning during which “Norfolk Southern notified SDDC that a major rail line servicing Fort Stewart to the Port of Charleston was taken offline to investigate malfunctions in a switching station.”
One possible cause of switching station malfunctions includes spoofing or jamming switching the control signals. Such an incident occurred in a Polish tram hacking attack in 2008. On this occasion, a 14-yearold boy used a homemade infrared transmitter to trip rail switches and redirect trains. Four trams were derailed, and a dozen people injured.58 The device, made from a television controller, was capable of controlling all junctions on the line, and the boy had written in his schoolbook where the best junctions for moving trains around were.59
After consulting with SDDC, the team learned that most rail switches in the contiguous United States are controlled by line of sight. Although the rail companies have a smart system for checking the rail via a networked service, track switching depends on radio signals sent from the engine to the switch. Rather than derailment via infrared signal hacking, a replay attack could be employed to spoof a signal and switch the track. Alternatively, a jammed radio signal could cause derailment because a train may need to adjust its speed when traversing a junction. Beyond rail delays, a secondary impact of a derailment on the communications network could be a severed fiber cable because fiber is also placed along rail rights-of-way.
Data Sources and Calibration: To model such a disruption, the CIRI team constructed a rail transportation network based upon publicly available GIS data from the United States Geological Survey (USGS) National Transportation Map (DS-TR.N-3) as well as the Federal Railroad Administration’s rail junctions (DS-TR.N-5). Vehicle schedules provided by SDDC were used to determine when trains left Fort Stewart and when they were expected to arrive at the Port of Charleston. The CIRI/ACI team consulted with SDDC to calibrate the baseline routes computed, the duration of the train route (18 hours), and the speed of the train. The duration of the train on the route, as noted during the discussion, does not include staging, prepping, and loading of material onto the train. Other factors that may affect train speed include tunnels, bridge limitations, terrain, and environment (e.g., flooding); these were not modeled.

Figure 29: Baseline rail movements from Fort Stewart to Charleston (shown in green) along a regional rail network provided by USGS (shown in orange).
58 Chuck Squatriglia, “Polish Teen Hacks His City’s Trams, Chaos Ensues,” Wired, January 11, 2008, https://www.wired.com/2008/01/polishteen-hac/.
59 Tim Wilson, “Teenage Hacker Takes Over Polish Tram System,” Dark Reading, January 11, 2008, https://w2.darkreading.com/attacksbreaches/teenage-hacker-takes-over-polish-tram-system/d/d-id/1129231?&.
Figure 29 illustrates the regional rail network provided by the USGS National Transportation Map (shown in orange). One key takeaway is that in the case of the Port of Charleston, there appears to be one direct route from Fort Stewart to the Port of Charleston (shown in green). This could lead to a single point of rail failure. A second route through Columbia, though less direct, provides a potential alternative route. The impact of a derailment on the SDDC Plan of Action and Milestones is illustrated in figure 30.

Figure 30: Impact of a Derailment on the SDDC Plan of Action and Milestones
The derailment CIRI modeled occurs shortly after the junction at Yemassee, where the line from Fort Stewart branches between Charleston and Columbia, SC. Note that to get the pieces from the derailed May 1 train, line haul trucks (shown in orange) are sent from the point of disruption (just after the railway splits in Yemassee) to the North Charleston Terminal. Based on fieldwork with Port Everglades and the Florida East Coast Railway, CIRI estimated a derailment would take 2 days to clear. As a result, the train on May 2 (shown in dashed black lines) as well as possibly May 3 (not shown) are affected. There may be three options to address this delay: wait to move the train until the derailment has been cleared; use another mode of transportation to the port; or, if possible, reroute the trains scheduled to depart around the obstructed railway.
The first case in the time-location diagram illustrates that it may be possible to reschedule the May 2 train to May 3 or 4 (shown in dashed orange). In the case of May 3, the rescheduled train might interfere with the train originally scheduled for May 3, but this would cause less delay at the port if the order of arrival of pieces were significant. In the case of May 4, other alternative modes of transport could be useful. There may be a risk associated with reducing the slack between shipments on rail.
The second response option would have the fort move pieces originally scheduled for the May 2 train via commercial long haul. It would be important to consider the risks of increased gate utilization to determine the impact of a gate outage (e.g., gate operating system [GOS] failure). Queueing theory provides a formalism for exploring such considerations and is part of the PDT discrete-event simulation tool. In addition, increased dependencies on trucking companies could increase the impact of disrupting such a company’s telemetry network.
A third option, if the derailment allowed it, would be to reroute the scheduled trains. This might make sense if the time frame or risk associated with the option were more optimal than the time frame or risk associated with the first and second options. SDDC stated that such an option would likely not be chosen. Nonetheless, this analysis considers the cyber-physical risks of rerouting a train.
According to SDDC, this alternative route is determined by the rail company (Norfolk Southern). The PDT multicommodity network flow optimizer selected a route through Columbia to explore secondary effects on transportation and communications systems as goods move via this alternative route (shown in figure 31).

Figure 31: A derailment close to the junction at Yemassee would force a delay and possibly reroute the train. Regional routes are shown for a derailment whose impact lasts from April 26–28 (day 3). Alternate routes (shown in red) are for trains 2 and 3.
Rerouting vehicle movements has secondary effects on social, local transportation, and communications domains. First, from a social standpoint, JV 3.0 chat logs suggest that rerouting movements would require a battalion commander to request support from a higher command: “841st Battalion: Roadblock requires support from higher command, battalion commander will submit a written doc to command requesting support to look at diverting assets from brigade to request follow on actions. Engage with Base and Port Readiness Committee.” Second, local transportation systems in Charleston (or even Columbia) may be affected if pieces are rerouted via vehicle or train. Figure 32 illustrates a local view of train routes taken through Charleston under normal (yellow) and disrupted (red) conditions. The section on Disruption 3 (D3) later in this appendix demonstrates how the choice of route may affect the ability of an adversary to further disrupt movements. Third, the impact of rerouting vehicle movements on the communication domain is the focus of the next section, “Disruption 2 (D2).”

Figure 32: Rerouting movements in a rural location can impact local movements through the city. Baseline and disrupted transportation flows (yellow and red, respectively) are illustrated here.
*Key Takeaways: *
There is one primary rail route from Fort Stewart to Charleston.
Jamming or spoofing of rail signals can result in derailment.
According to SDDC, a derailment in the city would be worse than in a rural area.
But rerouting from a rural area (either by rail or road) can still affect city transportation movements and cause delays in train arrivals to the port.
The choice of route is up to the rail company (private industry), but it must be approved by higher command.
Disruption 2 (D2): Rail Delays Due to Communications Network Degradation
Railroad companies are increasingly adopting digital communications as a cheaper and more easily maintained technology than copper. For example, Norfolk Southern “uses cell phones to transmit data between field sites and central offices.”60 CSX Transportation has conductors and field workers
60 Angela Cotey, “Railroad Communications Technology: From Cellular to Radio to Satellite to Wi-Fi,” Progressive Railroading, May 2012, https://www.progressiverailroading.com/norfolk_southern/article/Railroad-communications-technology-from-cellular-to-radio-tosatellite-to-Wi-Fi–30947.
communicate with each other through cell phones, including applications on the phones. These applications include reporting systems for conductors, services for track inspectors and signal maintainers, and applications for communications with truck drivers and intermodal yard operators. Wi-Fi is also used for communications in remote locations, with railroad companies building their own networks to cover regions with no cell coverage.
During the JV 3.0 exercises, some injects might have been caused by disruptions to a railroads’ communications networks. For example, on Monday at 6:01 p.m., county transportation officials discovered a wireless router connected to a traffic box in a remote location. Such routers could also have been deployed in a remote region of a railroad’s wireless network and thereby affected communications. In addition, on Tuesday at 3:47 p.m., Norfolk Southern had its crews verify that rail lines were clear and had not been tampered with or damaged. However, communications required to use the rail could have been damaged.
In an alternative scenario, however, communications required for using the rail could have been damaged. During discussion of the scenario with SDDC, it was observed that if a cell tower were to go down, other towers in the area could pick up service, and even if a signal were lost, it would be just an annoyance. However, during the exercise, stakeholders often commented on their concern over communications going down. In addition, degradation of the cell phone network could result in loss of data upon which many of the previously mentioned digital communications adopted by railroad companies depend.
An additional concern is man-in-the-middle (MITM) attacks via unmanned aerial vehicles (UAVs). Specifically, UAVs could provide a Wi-Fi signal that could be used to steal signals from a rail company’s rural wireless networks. UAVs are used to patrol by railroads because rail police cannot access remote locations. Thus, such a capability could be used by an adversary. SDDC confirmed that whether the rail route is covered by satellite, cell, or Wi-Fi, such a threat model is worth exploring further.
Data Sources and Calibration: In addition to the aforementioned data sources provided by USGS, this analysis uses the Department of Homeland Security (DHS) Homeland Infrastructure Foundation-Level Data’s (HIFLD’s) GIS data on cell phone tower locations (DS-CM.N-3). These locations were used to compute a Voronoi diagram to determine which cell phone towers provided which communications along the railway network.

Figure 33 illustrates the cell phone tower coverage along several rail routes from Fort Stewart to Charleston’s North Terminal. The interaction between the choice of route taken and communications networks should be considered to protect potentially sensitive information about movements.
Figure 33: This figure depicts coverage provided by cell phone towers modeled as a Voronoi diagram. The points within each blue region connect to the same (closest) tower. Choice of route taken by rail should also consider the communications networks upon which movements depend.
For example, changing the route in response to a derailment, as in Disruption 1, affects the cell phone towers (and potentially companies) upon which power projection depends. This is shown in more detail for Charleston in figure 34.

Figure 34: Choice of route taken by rail should also consider the communications networks (and companies) upon which movements depend.
Key Takeaways:
Route choice may affect the exposure of data to adversaries, depending upon the communications networks utilized.
Exposure to UAV-based MITM attacks may be worse in rural areas, where railroad companies rely on wireless networks.
Technologies such as Stingray may also enable one to use MITM methods to access operational data via cell phone signals used by emerging applications employed by rail companies.
Disruption 3 (D3): Traffic Congestion Resulting from Cyberattacks
In addition to potentially altering a movement’s risk posture in the cyber domain, rerouting vehicle movements in response to an initial disruption may also increase risk relative to other domains. For example, by diverting rail movements through the more heavily populated area of a municipality (e.g., due to the rural disruption in D1), protestors may have more chances to disrupt the route once the train enters the city. An example of such an occurrence is the cyberattacks and reinforced protests that affect the Bay Area Rapid Transit system. Similar disruptions might be possible during power projection through a city.
During the JV 3.0 exercises, several MSEL injects involved protestors blocking or otherwise affecting traffic. For example, on Monday morning, the main access gate sporadically failed to open, and on Tuesday afternoon, main terminal gates were the site of protests. A failed GOS can cause significant traffic congestion at a port. For example, the NotPetya ransomware affected one Maersk terminal where trucks collected “bumper to bumper, farther than [one] could see.”61 The PDT has been used to model the impact of GOS outages.62 This scenario considers the impact of protests causing the rerouting of rail and vehicle movements through a common cell phone tower.
In addition, exercise chat logs reflect related concerns by exercise participants. First, stakeholders were concerned about congestion on roadways, especially when combined with rail line degradation: “SDDC concerned about crash on I95 (other Feds not aware) and impact on degrading Ft. Stewart movement; especially in light of rail line degradation.” Furthermore, congestion resulting from protests can degrade the ability to keep military and commercial traffic separate: “841st wondering how the protests and gate issues would affect one’s ability to keep military and commercial traffic separate. They could manually validate TWIC but a military truck could go in the commercial side of the port.”
Data Sources and Calibration: The same datasets as those mentioned previously were used in this analysis. In addition, vehicle movements by roadway were obtained from SDDC that were aligned with the JV 3.0 scenario time line. The choice of roadway routes was validated using Google Maps for traveling from I-26 in the northwest corner of the city to North Charleston Terminal. Note that the primary and secondary road optimal routes computed by the PDT optimizer align with the routes chosen by Google Maps for the same source and destination. The computed optimal routes approximately follow the GIS roadways because they were computed on GIS transportation networks.
61 Andy Greenberg, “The Untold Story of NotPetya, the Most Devastating Cyberattack in History,” Wired, August 22, 2018, https://www. wired.com/story/notpetya-cyberattack-ukraine-russia-code-crashed-the-world/.
62 Gabriel A. Weaver, Mark Van Moer, and Glen R. Salo, “Stakeholder-Centric Analyses of Simulated Shipping Port Disruptions,” in 2019 Simulation Winter Conference (New York City: Institute of Electrical and Electronics Engineers, 2019).
reduced in size via the aforementioned method based on hierarchy trees.63 Vehicles moved on the roadway at 55 miles per hour and were considered late if they arrived after more than 30 minutes (Google Maps estimated that the trip would take 9 minutes).
Figure 35 illustrates baseline road and rail routes through Charleston (shown in green and blue, respectively) as well as rerouted rail routes in response to D1 (shown in red). As a result of this response to D1, there appears to be a potential single point of disruption along the Mark Clark Expressway where road movements are affected. Moreover, this point of convergence within a small geographic region opens up opportunities for communications network disruptions or data gathering, as discussed in D2.
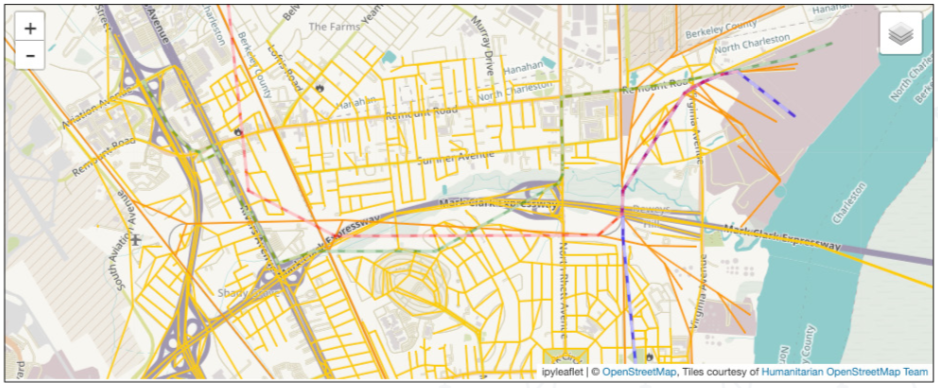
Figure 35: Baseline road routes through Charleston shown alongside baseline and disrupted rail routes (blue and red) following derailment in D1.
CIRI modeled a 1-day protest. This protest would directly affect commercial line haul, which travels from fort to port if held sometime during April 27–30. In the context of train derailment mitigation actions (D1), a protest held on May 1 could interfere with additional line haul traffic carrying pieces from the derailed train. In the context of response actions to transport pieces from the May 2 train, a protest on May 2–4 could interfere with either commercial long-haul trucks carrying rescheduled pieces or rerouted trains moving via Columbia.
Specifically, if the protestors were able to simultaneously disrupt the nearby rail line taken by rerouted trains, another mitigation would have to be considered for rail as well. We note that, alternatively, unrelated protests might also occur in Columbia (as described in D1) to disrupt rail movement but have less effect on long-haul and convoy routes.
63 Buchsbaum and Westbrook, “Hierarchical Graph Views.
Figure 36 illustrates the recomputed optimal road and rail routes (shown in red and purple, respectively), given a hybrid disruption consisting of a rural train derailment and city protestors demonstrating along the highway. We note that this shifts the intersection of rail, traffic, and cell phone towers to a new, single geographic region at the intersection of Remount Road and Virginia Avenue

Figure 36: Rerouting road and rail movements in response to a protest on Mark Clark Expressway results in a new potential disruption point at the intersection of Remount Road and Virginia Avenue.
Key Takeaways:
Rerouting traffic can result in new single points of failure across multiple critical infrastructure domains.
Planners should be aware of changing risk due to the data or stakeholder dependencies of secondary and tertiary routes and time delays resulting from disrupted movements.
Broader Impact
The scenarios considered in this appendix are based on historical incidents in which MTS stakeholders were disrupted via their communications/IT systems. The function of the MTS depends upon crossorganizational coordination among multiple stakeholder organizations. Cyber-originating disruptions experienced by these stakeholders, such as those listed in table 9, might be leveraged by an adversary during coordinated gray-zone disruptions like those exercised during JV 3.0.64 Some Port of Charleston stakeholders opined that this level of dependence creates a requirement for information sharing and analysis organizations focused on the needs of specific regions.
In table 9, each incident is grouped by the type of stakeholder that was affected; the corresponding affected systems and Common Attack Pattern Enumeration and Classification identifiers (CAPEC-IDs) are also listed.65

 Table 9: Historical Communication/IT System Incidents among MTS Stakeholders
64 Greenberg, “The Untold Story”; Sameer C. Mohindru, “Shipping: BW Group’s Computer Systems Hacked; Steps Up Cyber Security,” S&P Global Platts, October 2017, https://www.spglobal.com/platts/en/market-insights/latest-news/shipping/101317-shippingbw-groups-computer-systems-hacked-steps-up-cyber-security; Marvin the Robot, “New Petya / NotPetya / ExPetr Ransomware Outbreak,” Kaspersky Daily (blog), June 27, 2017, https://usa.kaspersky.com/blog/new-ransomware-epidemics/11710/; Senate Committee on Armed Services, Inquiry into Cyber Intrusions Affecting U.S. Transportation Command Contractors (Washington, DC: U.S. Government Printing Office, 2014); Miranda Green, “Romanian Hackers Infiltrated 65% of DC’s Outdoor Surveillance Cameras,” CNN, December 20, 2017, https://www.cnn.com/2017/12/20/politics/romanian-hackers-dc-cameras/index.html; Division of Emergency Management, 2016 State of Wisconsin Hazard Mitigation Plan (Madison, WI: Wisconsin Department of Military Affairs, December 2016); Burney Simpson, “Cyberattacks Called a Growing Threat to Trucking Industry,” Transport Topics, June 7, 2018, https://www. ttnews.com/articles/cyberattacks-called-growing-threat-trucking-industry; Tom Bateman, “Police Warning after Drug Traffickers’ Cyber-Attack,” BBC News, October 16, 2013, https://www.bbc.com/news/world-europe-24539417; “Ransomware Cripples IT Systems of Inland Port in Washington State,” The Maritime Executive, November 19, 2020, https://www.maritime-executive.com/article/ ransomware-attack-cripples-systems-of-inland-port-in-washington-state; Andrew Tsonchev, “Troubled Waters: Cyber-Attacks on San Diego and Barcelona’s Ports,” Darktrace (blog), October 4, 2018, https://www.darktrace.com/en/blog/troubled-waters-cyber-attackson-san-diego-and-barcelonas-ports/; “Chinese Shipping Firm Infected by Ransomware,” BBC News, July 26, 2018, https://www. bbc.com/news/technology-44965163; Emil Muccin, “Cyber Security at Sea,” The Maritime Executive, April 21, 2016, https://www. maritime-executive.com/blog/cyber-security-at-sea; and Catalin Cimpanu, “US Coast Guard Warns about Malware Designed to Disrupt Ships’ Computer Systems,” ZDNet, July 9, 2019, https://www.zdnet.com/article/us-coast-guard-warns-about-malware-designed-todisrupt-ships-computer-systems/.
65 “About CAPEC,” MITRE (website), updated April 4, 2019, https://capec.mitre.org/about/index.html.
Future Work
This research, jointly conducted by the ACI and CIRI, has sought to quantify the impact of disruptions on cross-organizational, interinfrastructure dependencies. This appendix has focused on cyberoriginating disruptions to the MTS at a regional and municipal level. However, prior work sponsored by CIRI focused on a detailed port view and the impact of disruptions to services provided by port stakeholder communications/IT networks. A detailed study of the impact of a GOS outage on various stakeholders as well as the impact that various stakeholders have on overall port operation may be found in CIRI’s 2019 Simulation Winter Conference paper.66 Such cross-organizational dependencies and how they affect overall port operation may be of particular interest to NATO and United States Indo-Pacific Command given programs such as the Belt and Road Initiative. Ongoing work in the communications/IT sector is looking to emulate and quantify the impact of targeted ransomware attacks on automated shipping ports. This work is actively being developed in collaboration with Ports of Auckland, New Zealand, and Mandiant/FireEye industrial control system team members.

Figure 37: Geographic Proximity of Electrical Power Lines, Substations, and Power Plants at a Regional and Municipal Level
Other scenarios could be considered that integrate additional critical infrastructure systems. For example, the work of the Defense Advanced Research Projects Agency Rapid Attack Detection, Isolation and Characterization Systems, the testbed for which is hosted at
66 Weaver, Van Moer, and Salo, “Stakeholder-Centric Analyses.”
UIUC, could be integrated to analyze the impact of cyberattacks on the electrical power grid in the context of the MTS. Figure 37 illustrates the geographic proximity of electrical power lines, substations (dark-green points), and power plants (lime-green points) at a regional and municipal level. Note that the North Charleston Terminal has its own biomass power plant, according to the available DHS HIFLD data. Such research would also build on previous work by Weaver to model cyber-physical dependencies within the bulk electric power system, with a focus on protection schemes.67
Conclusions
The MTS accounts for more than $4.6 trillion of annual economic activity—nearly a quarter of the U.S. gross domestic product.68 Preparing for a major disruption is key to building resilience for such critical infrastructure.
The PDT provides stakeholders with the ability to accurately model commodity flows through a shipping port, introduce a wide range of cyber and/or physical disruptions, and calculate various economic impacts of such disruptions. The PDT enables stakeholders to quantify the impact of crossinfrastructure, interorganizational disruptions in an evolving natural and man-made environment. To conduct the research presented in this appendix, CIRI extended the PDT to include fort to port. The supporting framework used to provide analyses such as this one is readily applicable to other municipalities, such as Savannah, GA, and other commercial strategic seaports.
67 Gabriel A. Weaver et al., “Cyber-Physical Models for Power Grid Security Analysis: 8-Substation Case,” in 2016 IEEE International Conference on Smart Grid Communications (SmartGridComm) (New York City: Institute of Electrical and Electronics Engineers, 2016).
68 Martin Associates, 2018 National Economic Impact of the U.S. Coastal Port System (Alexandria, VA: American Association of Port Authorities, March 2019).
Table of Contents
- 1. FOREWORD
- 2. ACKNOWLEDGMENTS
- 3. INTRODUCTION - JACK VOLTAIC 3.0
- 4. JACK VOLTAIC RESEARCH METHODOLOGY
- 5. EXECUTION
- 6. FINDINGS
- 7. CONCLUSION
- APPENDIX A – ACRONYMS
- APPENDIX B – PARTNERS
- APPENDIX C – SCENARIO
- APPENDIX D – LAW/POLICY TABLETOP EXERCISE (TTX)
- APPENDIX E – LIVE-FIRE EXERCISE
- APPENDIX F – MILITARY TESTIMONIALS
- APPENDIX G – PRIVATE INDUSTRY TESTIMONIALS
- APPENDIX H – ALL HAZARDS ANALYSIS (AHA)
- APPENDIX I – CIRI FORT-TO-PORT DISRUPTION
- APPENDIX J – REQUIRED DELIVERY DATE (RDD) SIMULATION
- APPENDIX K – DSCA/DSCIR