1 Introduction
Plug-in hybrid electric vehicles (PHEVs) and battery electric vehicles (BEVs)—collectively known as plug-in electric vehicles (PEVs)—provide various benefits to the United States. They reduce reliance on petroleum, which accounts for over 90% of total U.S. transportation energy consumption (U.S. Energy Information Administration [EIA] 2017) and is characterized by an extremely volatile market. Substituting electricity for gasoline and diesel could significantly improve U.S. energy security, providing greater fuel diversity in a market currently dominated by a single energy source. PEVs also produce zero tailpipe emissions and potentially low or zero greenhouse gas emissions, depending on the electricity generation mix (Orsi et al. 2016).
PEV sales in the United States increased by 40% in 2016, reaching a total stock of over 500,000 vehicles (IHS Markit 2017). This rapid market growth is the result of significant advances in PEV technologies, most notably the rapidly falling cost of lithium-ion batteries used in automotive applications (U. S. Department of Energy [DOE] 2017a, Nykvist and Nilsson 2015), as well as policy support. Policy support includes government research and development support (which also enabled battery technology advancements); technical and cost targets, mandates, and regulations (e.g., corporate average fuel economy [CAFE] standards and zero emission vehicle [ZEV] mandates); financial incentives for PEV purchase and charging station installations; and other measures increasing the value proposition of alternative fuel vehicles (e.g., preferential parking or access to high-occupancy vehicle lanes) (International Energy Agency [IEA] 2017). Still, widespread market adoption of PEVs remains hindered by many factors, including limited availability of models and styles, higher cost compared with conventional vehicles, and the lack of a convenient and ubiquitous network of charging stations.
Understanding the barriers to and benefits of deploying a widespread and effective network of PEV charging stations, also known as electric vehicle supply equipment (EVSE), is particularly important. Such a network would promote PEV consumer acceptance and market growth, enable long-distance travel for BEVs (alleviating the range anxiety concerns of many consumers), and potentially increase the share of electric miles driven by PHEVs. Infrastructure planning must anticipate PEV adoption while remaining cost-effective so low station utilization does not severely undermine the business case for building and operating stations (Melaina et al. 2017). Sufficient revenue is required to build and continue operating the EVSE network as the PEV market grows over time.
This report presents an approach for developing a U.S. network of non-residential EVSE that enables broader PEV adoption and maximizes PEV use. This analysis can help inform various public and private stakeholders who are seeking to provide nationwide charging coverage and improve the business case for building stations by maximizing station utilization.
1.1 Recent EVSE Initiatives and Analysis Studies
Several recent public and private initiatives and pilot projects are promoting EVSE growth across the United States as a way to increase PEV adoption by enhancing consumer familiarity and acceptance of this technology as well as providing a more convenient network of charging stations. In particular, direct current fast charging (DCFC) is receiving significant attention as the fastest PEV charging system currently available. Tesla’s Supercharger, CHAdeMO, and SAE’s combined charging system (CCS) are the currently available standards for DCFC. The landscape of DCFC in the United States is expected to change significantly with the penetration of longer-range BEVs (with over 200 miles of driving range), which likely will rely on DCFC to make long-distance trips (LDTs). While fast charging currently ranges between 50 and 120 kilowatts (kW), power levels up to 400 kW are currently being explored to reduce charging time and provide a more convenient consumer experience.
Over the past five years, Tesla has established a network of 357 fast-charging stations, supporting 2,478 individual fast chargers rated at up to 120 kW (DOE 2017b). Each supercharger station has between one and 12 120-kW plugs, with an average of seven plugs per station. As the only automaker selling long-range BEVs in the United States during this period, Tesla started addressing the circular dilemma between alternative fuel vehicle adoption and refueling infrastructure availability by deploying a national network of proprietary charging stations to enable long-distance travel for Tesla vehicles. Tesla recently announced the goal of doubling the number of superchargers both nationally and globally. As of June 2017, the average distance between Tesla supercharger stations is approximately 67 miles (based on data from DOE [2017b]).
Electrify America—a project funded in December 2016 by Volkswagen Group of America as required by Appendix C to the 2.0-Liter Partial Consent Decree—has committed to investing $2 billion over the next 10 years in ZEV infrastructure and education programs, including $800 million in California alone (Electrify America 2017, Green Car Reports 2017). In its first national ZEV investment cycle (30 months, through mid2019), Electrify America plans to develop a large network of community-based PEV charging stations as well as approximately 300 fast-charging stations along high-traffic corridors between metropolitan areas in 39 states. Each corridor DCFC station will include four to ten plugs with an average of five plugs per station. Individual plugs will be rated at 150 kW with the ability to be upgraded to up to 350 kW for future vehicles that can accept higher power charging. Corridor DCFC stations will be spaced on average 70 miles apart with a maximum distance of 120 miles between consecutive stations. The Electrify America network will be nonproprietary by providing both CHAdeMO and SAE CCS plug types, allowing any BEV to charge.
Nissan and BMW are partnering to double the EVgo network of fast charging stations across the United States. As of January 2017, an additional 174 EVgo 50-kW fast charging stations across 33 states have been installed, with an additional 50 stations planned for 2017 (Nissan 2017).
The U.S. Department of Transportation (DOT) recently designated several highways as alternative fuel corridors (including 48 PEV charging corridors) with the intent of establishing a comprehensive national network of refueling stations to promote the continued adoption of alternative fuel vehicles (DOT 2017a). This network will include nationally consistent signage and is intended to encourage multi-state collaborations of public/private stakeholders.
Launched in 2009, the EV Project partnered with city, regional, and state governments; utilities; and other organizations in 18 cities to deploy about 14,000 Level 2 PEV chargers and 300 direct current (DC) fast chargers (DOE 2014). The EV Project was the first large-scale data-collection effort for PEVs and related infrastructure in the United States (Idaho National Laboratory [INL] 2013).
In parallel to these initiatives, several analytical studies have explored the opportunities and implications related to EVSE development. In this early market phase for PEV adoption, vehicle configurations, styles, and all-electric ranges are changing rapidly in response to evolving consumer preferences and technology improvements (particularly battery cost). Future vehicle attributes and requirements remain uncertain, and the most effective EVSE strategy to support PEV adoption will depend on how these trends evolve over time. Still, various stakeholders must anticipate a range of possible future trends to develop cost- and marketeffective EVSE plans. In this context, scenario analysis and market simulation studies can inform different stakeholders during the EVSE planning process, including federal and local governments, private investors, vehicle manufacturers, and infrastructure developers.
In the 18th edition of the Automotive Executive Survey, an annual international assessment of the current state and future prospects of the worldwide automotive industry, KPMG focused on the role of vehicle electrification and its connection with infrastructure (KPMG 2017). Although 50% of the 953 executives who participated in the KPMG survey identified BEVs as the industry’s key near-term (2017 to 2025) trend, most respondents (62% of executives) also absolutely or partly agreed that BEVs “will fail” owing to infrastructure challenges. This pessimistic long-term view of the industry’s ability to overcome infrastructure challenges was more pronounced from respondents in Organisation for Economic Co-operation and Development countries, whereas respondents in China were more optimistic. KPMG concluded that significant investments in a ubiquitous and user-friendly PEV charging infrastructure are crucial for supporting long-term PEV adoption and that overcoming the range anxiety issue for BEV users is critical for the long-term survival of BEVs.
INL recently leveraged information from previous data collection activities to assess criteria for designing and upgrading DCFC complexes that provide fast-charging opportunities for BEV drivers in urban communities and on corridors (Francfort et al. 2017). Findings and lessons learned suggest that “DCFCs are most useful when they are sited within a half-mile of major transportation corridors, where they can support both intra and inter-urban travel” and that “there is a greater likelihood that a DCFC will be highly utilized if it is located at or near a workplace where employees are likely to own PEVs” (Francfort et al. 2017).
Navigant Research has published several studies about opportunities for global PEV and related infrastructure markets. Its DC Charging Map for the United States explores fast-charging opportunities that enable intercity, interstate, and cross-country travel in response to market trends that are promoting long-range BEV adoption (such as battery capacities of ~60 kilowatt-hours) (Navigant Research 2016). The report maps the progression of fast-charging stations needed to meet the demands of light-duty BEVs through a phased rollout, focusing on the needs of long-range BEVs. The analysis shows that 95 fast charging stations would provide basic longdistance coverage for BEV travel. It also shows that sufficient coverage for BEVs in the top 100 metropolitan areas could be achieved with 408 stations.
The California Energy Commission’s Statewide PEV Infrastructure Assessment is an example of scenario analysis developed at the state level (Melaina and Eichman 2015, Melaina and Helwig 2014). In this study, PEV sales are estimated based on compliance with the ZEV mandate, and PEV travel simulations are performed to assess the role of public infrastructure in future PEV market growth, focusing on the degree to which increased public charging may increase e-miles. Results show that 225 to 775 fast-charging stations will be required to support 1 million PEVs in California, depending on charging preference. One conclusion of the report is that insights from analytical studies are required to guide the development of effective near-term fastcharger installation strategies.
A 2013 National Academy of Sciences report explored alternative scenarios that would radically transform the U.S. passenger vehicle sector, including enabling technologies and adoption barriers (National Research Council 2013). The report identifies charging infrastructure availability as a major barrier to consumer adoption of PEVs.
1.2 Analytic Approach
This PEV charging study complements the existing literature by providing updated and comprehensive analysis of the national PEV charging infrastructure requirements within cities, towns, and rural areas and along corridors connecting them. It provides guidance to regional and national stakeholders on non-residential EVSE strategies and plans, both to reduce range anxiety as a barrier to increased PEV sales and to promote effective use of private/public infrastructure investments.
1.2.1 Conceptual Representation of PEV Charging Infrastructure Requirements
PEV charging infrastructure requirements—the number of stations and plugs required to provide a convenient and ubiquitous network of PEV charging opportunities—will evolve as PEV adoption increases. In particular, two driving forces characterize the charging infrastructure required to support a growing fleet of PEVs:
A basic level of geographic coverage is required to guarantee nationwide charging opportunities and enable long-distance travel for BEVs.
Over time, a larger network of stations will be required to satisfy growing charging demand. The requirement increases non-linearly with PEV market share. At low market shares, the requirement increases quickly because PEVs are clustered in particular areas and charging is concentrated during specific times such as after commuting periods and on weekends (for long-distance travel). As PEV market share increases, the infrastructure requirements increase less aggressively owing to the natural stochastic features of driving behavior—not all drivers will require charging in the same location and at the same time. In a fully developed market, each additional PEV leads to lower incremental requirements for PEV charging infrastructure.
Figure 1 illustrates coverage (blue line) and demand (black line) infrastructure requirements for different PEV market shares. The coverage requirement is independent of PEV adoption: even if few PEVs are deployed, a ubiquitous network of stations is required to enable long-distance travel, prevent range anxiety, and promote PEV adoption. Therefore, a “utilization gap” exists at low PEV market shares, which is characterized by a market demand for charging infrastructure that is lower than the required coverage infrastructure; the infrastructure is underutilized, which negatively impacts station financial performance and makes it difficult to justify investment in new stations (Melaina et al. 2017). As PEV adoption increases, the demand for charging infrastructure exceeds the coverage infrastructure, creating “market pull” for the installation of additional charging stations or the addition of plugs to existing stations.
 Figure 1. PEV charging requirements evolution as a function of PEV market share.
This report quantifies non-residential EVSE requirements necessary to meet consumer coverage expectations independent of PEV adoption level and to meet consumer demand in high PEV adoption scenarios. Coverage and demand estimates are made for:
Cities (486 Census Urban Areas, population greater than 50,000, 71% of U.S. population)
Towns (3,087 Census Urban Clusters, population 2,500 to 50,000, 10% of U.S. population)
Rural Areas (regions not covered by Census Urban Areas/Clusters, 19% of U.S. population)
Interstate Highway System Corridors (28,530 miles of highway).
1.2.2 Scenario Discussion
The majority of this report describes an analytic process for estimating PEV non-residential charging requirements within communities (cities, towns, and rural areas) and along Interstate corridors, assuming home charging is the dominant behavior. While it is not the intention of this work to forecast the future PEV market, PEV market scenarios are developed to exercise the infrastructure estimation methodology and highlight sensitivities. The analysis assigns no probabilities to any PEV market scenarios and considers none of the scenarios as most likely. However, a central scenario is established from which individual elements of the modeling framework are studied using parametric sensitivity analysis. PEV market conditions for the central scenario and sensitivities explored are shown in Table 1.
Table 1. PEV Market Conditions for the Central Scenario and Sensitivities Explored 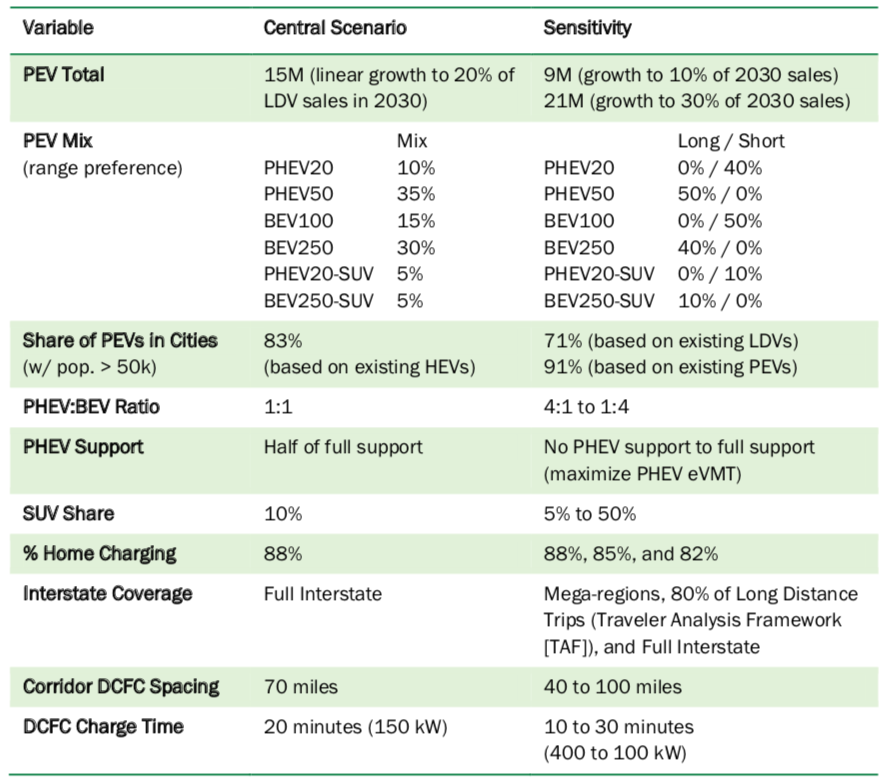
eVMT = miles achieved on electric power SUV = sport utility vehicle
The central scenario arbitrarily assumes a linear growth in the sale of new PEVs, climbing to 20% of all lightduty vehicle (LDV) sales in 2030. This sales rate would result in a total of 15 million PEVs on U.S. roads in 2030 (approximately 5% of the total U.S. LDV stock in 2030). Sensitivities around PEV sales are explored between 9 and 21 million PEVs (10% to 30% of U.S. LDV sales in 2030).
The range preference variable is meant to reflect relative adoption of the short- and long-range PHEVs and BEVs. For example, the central scenario features a preference for PHEVs with longer electric driving ranges, resulting in greater shares for PHEV50s and BEV250s (relative to PHEV20s and BEV100s, respectively). During the sensitivity analysis, a short-range preference is explored in which PEVs are exclusively comprised of PHEV20 and BEV100 vehicles (the long-range sensitivity shifts all PEVs to PHEV50 and BEV250 vehicles)
PEVs clustered in cities versus widespread adoption across the United States directly affects the degree to which infrastructure can be regionally concentrated. Three PEV dispersion scenarios are evaluated, each informed by the spatial dispersion of existing LDVs across the United States. The central scenario assumes 15 million PEVs are dispersed among cities, towns, and rural areas proportional to existing registrations of hybrid electric vehicles (HEVs). HEVs are considered a useful proxy for the spatial dispersion of an evolving PEV market based on their status as an advanced technology powertrain that predates the introduction of modern PEVs by approximately a decade. Allocating future PEVs using existing HEV registrations results in 83% of PEVs being located in cities (population greater than 50,000). Sensitivities on the spatial dispersion of future PEVs are developed based on the existing dispersion of all LDVs (71% in cities) and existing PEVs (91% in cities). Registration data used to develop these estimates are discussed in Section 2.1.
The central scenario assumes a 1:1 ratio between future PHEVs and BEVs (similar to existing PEV registrations, see Section 2.1). Arbitrary sensitivities around this parameter are explored, from 4:1 (80% PHEV) to 1:4 (80% BEV).
PHEVs feature internal combustion engines for backup power and consequently have no hard requirements for non-residential charging infrastructure. PHEVs can however utilize work and public Level 2 (L2) EVSE to improve the percent of miles achieved on electric power (eVMT); however, PHEVs are restricted from using DCFC in this analysis. Providing full PHEV support in this model implies enough charging plugs to enable consumers to maximize eVMT (but not necessarily reach 100% eVMT as individual trips may exceed the PHEV single charge range and L2 EVSE is restricted to destination charging in this project). Conversely, providing no PHEV support implies that no L2 EVSE is allocated on behalf of PHEVs in the model. Partial PHEV support is implemented in the central scenario reflecting 50% of full support.
The central scenario arbitrarily assumes a 10% sport utility vehicle (SUV) share within the PEV segment. While relatively modest given the increasing popularity of SUVs in the context of all LDVs (including conventional vehicles), existing PEV registrations reflect a mere 5% market share for electric SUVs (see Section 3.2.2). SUV market shares within the PEV segment are explored between 5% and 50% during sensitivity analysis.
All scenarios assume the majority of consumers prefer to do most of their charging at their home location. In the central scenario, 100% of PEVs are simulated as having a home-dominant charging preference (resulting in 88% of charging taking place at home locations). Sensitivity analysis explores scenarios where 90% and 80% of PEVs are simulated with home-dominant charging behavior, with the remainder having work- and publicdominant charging behavior. This sensitivity results in PEVs performing 85% and 82% of charging at home locations.
Central scenario analysis of the interstate corridor network considers full coverage with average DCFC station spacing of 70 miles and a typical DCFC charge time of 20 minutes. DCFC coverage along the interstate network, station spacing, and average charge time are explored using the sensitivity analysis shown in Table 1.
1.2.3 Report Structure
The remainder of this report is structured as follows. Section 2 reviews the current status of the PEV market and EVSE infrastructure. Section 3 presents methods and results for non-residential community charging requirements, including L2 charging and fast-charging stations. Section 4 presents methods and results for fastcharging stations along interstate corridors. Finally, Section 5 summarizes the report’s findings and offers insights to decision makers who are working to deploy an effective charging infrastructure network in the United States.