- 4 DCFCs for Corridor Charging
4 DCFCs for Corridor Charging
Long-distance travel has been a critical barrier to BEV adoption, which has been exacerbated by the real and perceived range anxiety of drivers in the United States. While most single-day travel surveys suggest that a large majority of daily driving can be accommodated with a relatively short driving range (approximately 100 miles), analysis of longitudinal driving patterns reveals that a large segment of U.S. drivers routinely use personal vehicles for long-distance travel, with an average vehicle traveling 100 miles or more on 6 days per year (see Appendix ). These drivers would presumably require long-distance single-charge ranges and DCFC support along travel corridors to consider adopting BEVs as fully capable replacements for their existing vehicles. Even drivers who seldom make LDTs might exhibit similar adoption requirements based on their perceived need for long-distance driving.
This issue can be alleviated by providing access to an extensive and convenient network of DCFC stations along corridors that enable reliable long-distance intercity travel. The U.S. Interstate Highway System is an ideal basis for such a long-distance DCFC network. Its extensive, high-speed, controlled-access highways connect population centers and cross the country via various routes. Yet providing comprehensive DCFC coverage for the Interstate System presents a much smaller and simpler task compared with providing comprehensive coverage based on all other U.S. highways and state routes. Interstate-based coverage that is already underway and planned could result in a robust, national network within a few years, whereas community DCFC coverage of the scope described in Section 3 will likely take longer.
This section estimates the number of DCFC stations necessary to provide charging coverage across several network designs based on the Interstate System. Next, charging demand requirements are estimated to quantify the number of plugs at interstate corridor DCFC stations needed to support long-distance travel and minimize queuing during periods of high traffic. Then, a set of challenges associated with constructing and maintaining Interstate corridor DCFC stations is discussed. The analyses in these sections (Sections 4.1 to 0) consider only highways that are part of the Interstate System. Section 0 provides a brief discussion of the corridor charging support that could be enabled by the community-based DCFC stations discussed in Section 3.
4.1 DCFC Interstate Corridor Coverage Calculations
This section first defines the full Interstate network as a basis for developing hypothetical DCFC networks (Section 4.1.1). Because the full Interstate network is large, Section 4.1.2 prioritizes corridors to develop four alternative national DCFC network scenarios, forming a total of five hypothetical DCFC corridor networks as shown in Table 8. Finally, Section 0 discusses station spacing requirements for corridors. National corridor DCFC methodology and sensitivities are summarized in Figure 10.
Table 8. National DCFC Coverage Scenarios along U.S. Interstate Corridors 
 Figure 10. Methodology and sensitivity schematic for corridor DCFC analysis.
Table 9 and Figure 11 summarize the station-count results for each coverage scenario assuming three different average station-spacing values. The national station count ranges from 96 (for the mega-region network with 100-mile spacing) to 713 stations (for the full Interstate network with 40-mile spacing). Although this range is large, all scenarios are relatively modest compared with the regional DCFC investments that already have been made. As of June 2017, a total of 2,164 DCFC stations have been installed (357 by Tesla alone). However, most of these stations have been concentrated in urban areas, and the small number of corridor DCFC stations has been concentrated in areas of high PEV adoption—most notably along the West Coast, through northeast sections of the I-95 corridor, and in rural areas around Atlanta. Again, using the Tesla network as an example, as of June 2017 there were a total of 161 corridor DCFC stations in Tesla’s Supercharger network, enabling long-distance travel across most of the United States.
Table 9. Estimated National DCFC Station Counts to Cover Corridors under Different Scenarios

 Figure 11. Nationwide DCFC station counts to cover corridors as a function of station spacing for different scenarios.
4.1.1 Full Interstate Network
This section’s proposed network for hypothetical DCFC stations consists of Interstate segments connecting cities with a total length of 31,510 miles. This network excludes segments of Interstates within cities since DCFC stations within urban areas are assumed to be available; station count estimates for DCFC in cities are developed in Section 3. Excluding segments shorter than 25 miles (resulting from cities in close proximity), the relevant Interstate network is scaled down to a total length of 28,530 miles, illustrated in Figure 12, which also shows the network with 70-mile-radius buffers (approximating network coverage). This mile count does not consider double miles for both directions of travel or number of lanes on individual corridors, because a single DCFC station is assumed to serve both directions of travel and all lanes (assuming sufficient capacity, which is discussed in Section 4.2).
This road network was derived from the DOT’s National Highway Planning Network (v14.05) data set available through the Federal Highway Administration (FHWA) in shapefile format (FHWA 2017c). The full source data set was initially filtered to a set of Interstate highways. Next, a spatial overlay process clipped the filtered set of lines to exclude all segments and portions of line segments overlapping urban areas. A shapefile derived from the U.S. Census Bureau’s 2015 MAF/TIGER geographic database filtered to just urban areas provided the clipping bounds (U.S. Census Bureau 2015). Finally, post-processing routines assembled the many small remaining road segments into contiguous network segments. These segments were further separated at junctions where three or more original road segments converged.
 Figure 12. Interstate corridor network (thick red lines) considered in this analysis (70-mile radius red buffer approximates areas that would be served by the proposed DCFC network). Included for reference: yellow polygons represent cities, purple points represent towns, and thin black lines represent the national highway system.
(Satellite imagery credit: © 2017 Google, Map Data © 2017 Tele Atlas)
Providing full coverage to this Interstate Highway network would require many stations, some of which would be poorly utilized owing to the uneven distribution of traffic volume on the network. Hence, it is desirable to prioritize corridors that will provide the highest utility to BEV drivers traveling beyond their vehicle’s range. In the next section, this prioritization is discussed for four alternative scenarios.
4.1.2 Corridor Prioritization
Here the Mega-region, DOT Alternative Fuel Corridors, Highway Performance Monitoring System (HPMS), and Traveler Analysis Framework (TAF) scenarios are described.
4.1.2.1 Mega-regions (Scenario 1)
Mega-regions are an interesting geographical trend that has emerged over the last few decades. Interlocking economic systems, shared natural resources and ecosystems, and common transportation systems link these population centers together. Most of the nation’s rapid population growth, and an even larger share of its economic expansion, are expected to take place in these large networks of metropolitan areas. The America 2050 initiative defines 11 U.S. mega-regions, reported in America 2050 (2017). Providing coverage for PEV charging along Interstates within each mega-region (that is, enabling reliable PEV travel within each megaregion, but not among different mega-regions) would result in the DCFC network shown in Figure 13, encompassing 96 to 239 DCFC stations (depending on station spacing). In Figure 13 and subsequent similar figures, the yellow buffer represents areas that hypothetically would be served by the proposed DCFC network.
 Figure 13. DCFC corridors providing coverage to intra-mega-region travel (70-mile radius yellow buffer approximates areas that would be served by the proposed DCFC network).
(Satellite imagery credit: © 2017 Google, Map Data © 2017 Tele Atlas)
4.1.2.2 DOT Alternative Fuel Corridors (Scenario 2)
The DOT Alternative Fuel Corridor Map for PEVs, shown in Figure 14, is also proposed as a scenario for a hypothetical DCFC network along U.S. highways (DOT 2017a). DOT has designated national PEV charging corridors in strategic locations along major highways to improve the mobility of electric vehicles (DOT 2017a). These corridors were nominated by state and local officials and elaborated in partnership with industry stakeholders. Every 5 years, DOT will issue a report reviewing charging and fueling infrastructure, analyzing standardization needs for fuel providers and purchasers, and reestablishing the goal of achieving strategic installation of fueling infrastructure in each corridor. Providing coverage for PEV charging along Interstates designated in the DOT Alternative Fuel Map would result in the DCFC network shown in Figure 15, encompassing 122 to 306 DCFC stations (depending on station spacing).
 Figure 14. PEV Alternative Fuel Corridors as designated by DOT Alternative Fuel Corridor Map
(DOT 2017a)
 Figure 15. DCFC corridors providing coverage as designated by the DOT Alternative Fuel Corridor Map (DOT 2017a) (70- mile radius yellow buffer approximates areas that would be served by the proposed DCFC network).
(Satellite imagery credit: © 2017 Google, Map Data © 2017 Tele Atlas)
4.1.2.3 Highway Performance Monitoring System (Scenario 3)
The HPMS is a freely available national-level data set that provides a wide array of detailed information on the nation’s highways (DOT 2017b). The HPMS contains information on most public roads as well as a combination of measured and estimated annual averaged daily traffic volumes. The latter is highly valuable for infrastructure planning purposes, because it enables traffic-based prioritization. Figure 16, in which line thickness is proportional to average traffic volume, shows that most road traffic is concentrated around major urban areas near the coasts and in the Midwest and South Central regions.
 Figure 16. U.S. Interstate Highway corridors. Line thickness is proportional to HPMS average daily traffic.
(Satellite imagery credit: © 2017 Google, Map Data © 2017 Tele Atlas)
 Figure 17. DCFC corridors providing coverage to the top 80% of HPMS annual average daily traffic (70-mile radius yellow buffer approximates areas that would be served by the proposed DCFC network).
(Satellite imagery credit: © 2017 Google, Map Data © 2017 Tele Atlas)
Providing coverage to the corridors capturing 80% of the traffic volume of the HPMS corridors would result in the DCFC network shown in Figure 17, encompassing 212 to 530 DCFC stations (depending on station spacing). Although it provides excellent coverage in the eastern half of the country and on the west coast, it does not enable cross-country travel. Another shortcoming of this network is that the total traffic volumes reported by HPMS are dominated by short-distance, routine commuting trips, which are unlikely to require DCFC. To address this shortcoming, another travel data set is investigated, as described in the following section.
4.1.2.4 Traveler Analysis Framework (Scenario 4)
Because it is impossible to single out LDTs from overall traffic volume, the FHWA created a synthetic data set to estimate long-distance passenger travel. FHWA’s TAF was modeled using a variety of predictors, such as population and economic activity, and calibrated to a large travel survey (FHWA 2013). TAF consists of a set of county-to-county trip tables for long-distance passenger trips (defined as trips longer than 100 miles) by automobile, bus, air, and rail. The TAF projects person-trip flows for the base year (2008) and for 2040, shown in Figure 18. This data set is valuable because it enables isolation of LDTs, which are typically difficult to isolate from standard single-day travel surveys owing to the relatively low frequency of such travel events. Isolating long-distance travel is of particular importance in the analysis of charging stations along intercity corridors.
 Figure 18. TAF summary statistics
Data from (FHWA 2013)
Figure 19 provides a visualization of the qualitative trip differences between travel modes. Air travel is the dominant mode for very long, cross-country trips. Bus and auto trips are mainly intra-regional, whereas passenger rail travel is restricted to a few routes where railways are available.
 Figure 19. TAF long-distance travel origin–destination pairs by mode; only top 10% visualized here for clarity.
(Satellite imagery credit: © 2017 Google, Map Data © 2017 Tele Atlas) Data from FHWA (2013)
The county-level resolution of TAF is highly valuable for long-distance traffic volume estimation, but it is too granular for meaningful visualization. Aggregating TAF data at the census division level, shown in Figure 20, reveals deep insights into intra- and inter-regional travel for different modes. A chord diagram (Krzywinski et al. 2009) provides a visually compelling way to visualize the travel volumes within and between regions. In such a diagram, the outermost band displays the relative share of trips originating from or ending in a given region. The innermost band shows the absolute volume in million passenger-trips per year. Finally, the chords connecting two regions are sized according to the volume of travel between them. Figure 21 shows an enlarged image of the TAF auto routes (top 10% of origin-destination pairs), and Figure 22 shows a chord diagram for the automobile TAF data set (top 10% of origin-destination pairs) by Census Division. Results in Figure 22 show that the South Atlantic, West South Central, and Pacific regions together account for nearly half the nation’s annual long-distance auto passenger trips. In addition, more than 80% of trips taking place in the Pacific division are within that division, whereas most LDTs in the East South Central division connect it with neighboring divisions.
 Figure 20. Map of U.S. Census divisions
(National Oceanic and Atmospheric Administration 2017)
 Figure 21. TAF long-distance auto passenger trip origin-destination pairs; only top 10% visualized here for clarity.
(Satellite imagery credit: © 2017 Google, Map Data © 2017 Tele Atlas) Data from FHWA (2013)
 Figure 22. Chord diagram generated using TAF long-distance auto passenger travel volume
(FHWA 2013)
To estimate long-distance travel volumes by highway corridor, the county-level origin-destination pairs in the TAF data set were routed onto the interstate network using a web-based mapping service that seeks to minimize travel time, the MapQuest Directions API (MapQuest 2017). Use of the MapQuest API is intended to approximate routes consumers actually take when completing LDTs. Figure 23 shows the results of this routing process where the thickness of each corridor corresponds to the total number of estimated annual LDTs on that corridor. Providing coverage to the corridors capturing 80% of the traffic volume of the TAF corridors would result in the DCFC network shown in Figure 24, encompassing 174 to 436 DCFC stations (depending on station spacing).
 Figure 23. U.S. Interstate Highway corridors. Line thickness proportional to TAF long-distance auto traffic.
(Satellite imagery credit: © 2017 Google, Map Data © 2017 Tele Atlas)
 Figure 24. DCFC corridors providing coverage to the top 80% of the TAF long-distance auto traffic (FHWA 2013) (70-mile radius yellow buffer approximates areas that would be served by the proposed DCFC network).
(Satellite imagery credit: © 2017 Google, Map Data © 2017 Tele Atlas)
NREL’s processing of TAF data onto the interstate network was compared against the HPMS data. Figure 25 shows NREL-derived TAF auto volume as a percentage of HPMS volume; green corridors have low TAF percentages and are primarily composed of short-distance trips, and magenta corridors have high TAF percentages and are primarily composed of LDTs. This map suggests that the majority of Interstate traffic in the Southwest consists of long distance (i.e., >100 miles) driving trips, whereas LDTs represent less than 20% of total traffic volume in most of the eastern half of the country. The fact that TAF-derived Interstate volumes are a fraction of HPMS-estimated volumes helps to establish confidence that the corridor volumes derived from TAF are within a reasonable range.
 Figure 25. Comparison of TAF and HPMS volumes (color scale proportional to TAF:HPMS ratio).
(Satellite imagery credit: © 2017 Google, Map Data © 2017 Tele Atlas)
4.1.3 Station Spacing
Another important consideration for planning effective DCFC networks is the spacing between two consecutive DCFC stations, here estimated based on the effective BEV range. Although the U.S. Environmental Protection Agency-rated range (Fueleconomy.gov 2017) provides a good estimate of vehicle ranges under typical driving conditions, the effective range often varies based on ambient and road conditions as well as driving style (Lohse-Busch et al. 2013, Neubauer and Wood, 2013). Moreover, battery capacity tends to slowly degrade over time, negatively affecting the real driving range of BEVs (Shirk and Wishart 2015, Neubauer and Wood 2015). In addition to technical considerations limiting the effective range of BEVs, consumer travel logistics and convenience play a significant role in how far a BEV driver is willing to drive on a single charge. Drivers are typically reluctant to wait until their battery is completely drained before recharging, resulting in an “arrival allowance.” Moreover, the rate of charge at DCFC stations tends to decrease toward high battery state-of-charge levels owing to battery safety considerations, and consumers are likely to depart a DCFC station before a BEV battery is fully charged to reduce their time spent charging, resulting in an “early departure penalty.” To capture these behavioral effects, it is assumed that under realistic conditions a BEV will be recharged with an arrival allowance of 30 miles of remaining range, and it will depart the DCFC station early with only 80% of charge. Figure 26 summarizes the factors determining the effective BEV range considered in this study.
Three scenarios are proposed for nominal station spacing (100, 70, and 40 miles), providing various levels of support for longer- and shorter-range BEVs. These station spacing scenarios are believed to cover the range of nominal station spacing ranges being pursued by industry. Electrify America has announced an average station spacing of 70 miles for its DCFC corridor network (Electrify America 2017). This spacing is almost identical to the Tesla supercharger network; nearest-neighbor analysis was performed on the Tesla Supercharger station locations publically available in the Alternative Fuels Data Center data set (DOE 2017b), revealing an average Tesla station spacing of 67 miles. Additionally, Navigant Research proposes two station spacing scenarios in its DC Charging Map for the United States: 130 miles for long-range BEVs, and 75 miles to also support short-range BEVs (Navigant Research 2016).
 Figure 26. Station spacing methodology proposed in this study.
4.2 DCFC Interstate Corridor Demand Calculations
The number of stations required to cover the proposed U.S. corridor network has been determined for a variety of coverage and station spacing scenarios. The utilization of these stations, however, will vary significantly depending on their location and on the size of the regional and national PEV markets. This section estimates the number of plugs required at each station to adequately respond to corridor charging demand as the PEV market evolves over time.
Plug count per station estimates are calculated for each corridor station as a function of DCFC charging time, BEV adoption level, peak traffic volume, and station spacing. This model assumes that faster DCFC charging times will decrease plug count requirements (faster vehicle turnover), that high peak traffic volumes from BEVs on long distance trips will increase plug count requirements (more vehicles to serve at individual stations), and that decreasing station spacing will decrease plug count requirements per station (allowing consumers to occasionally skip stations while on long distance trips).
4.2.1 DCFC Power Level
Extreme fast charging, with power levels from 120 kW up to 400 kW, has gained significant interest in recent years. These very high charge rates could provide 200 miles of range in 20 minutes for a 150-kW charger and under 10 minutes for a 400-kW charger, making BEVs more attractive to customers. The Tesla supercharger network currently provides up to 120 kW of power, while most other installed DCFC stations are currently rated at 50 kW.
Higher DCFC power levels are modeled as lowering the number of plugs per station required to support longdistance travel in BEVs: faster turnover of vehicles warrants less redundancy in terms of plugs per station. This report considers 150 kW per plug DCFC power levels providing a 20-minute charge to a BEV250 in the central scenario, with sensitivities explored between 10 and 30 minutes per fast charge event. Additionally, assumptions from Section 0 are carried over, namely that BEVs would on average arrive with 30 miles of range remaining and depart with 80% of a full charge.
4.2.2 TAF Volumes
Annualized estimates of LDT volume were developed for each segment of the corridor network using TAF projections (interpolated between 2008 and 2040 to represent 2030 long distance traffic volumes). Person-trips were converted to vehicle-trips using an average occupancy factor of 3.0, in accordance with the TAF documentation (FHWA 2013); note that the estimated occupancy factor on long-distance auto trips is significantly higher than urban occupancy factors, which include large shares of single-occupancy vehicles.
FHWA’s Traffic Monitoring Analysis System was used to estimate peak traffic ratios along Interstate corridors (FHWA 2017b). To estimate charging requirements for DCFC stations along corridors, the ratio between peak and average traffic volume was calculated for interstate corridor traffic count stations in California; California represents the largest PEV market, and results have been spot checked against other states for representativeness.
The peak hourly volume at the average Interstate corridor traffic count station in California was found to be 4.5 times greater than the annual average volume. Sizing for peak traffic using this factor would imply near elimination of queueing and potentially oversize the system. As such, a 90th percentile value traffic volume was found to be 2.3 times greater than the annual average volume. The peak factor of 2.3 is used in this work.
4.2.3 Results and Discussion
Plug requirements from individual corridors are aggregated to obtain an average number of plugs per DCFC station as a function of station spacing and projected BEV adoption. Figure 27 presents these aggregate results for three market adoption scenarios. They range from two plugs per station at a station spacing of 40 miles and a BEV adoption of 4 million to 12 plugs per station at a station spacing of 100 miles and a BEV adoption of 10 million. Six plugs per station are required for the central values of 70-mile spacing and 7 million BEVs. For comparison, Electrify America’s plans include five plugs per station with an average station spacing of 70 miles to support a BEV market of up to 10 million vehicles in 2030. Tesla’s existing proprietary network features an average of seven plugs per station and a spacing of 67 miles on average.
 Figure 27. Nationwide corridor DCFC station count versus station spacing, annual average volume.
Plug requirements at individual stations vary based on the long-distance travel associated with a given corridor. Figure 28 illustrates this variance using the central scenario as an illustrative example (full interstate coverage, 7 million BEVs, and 70 mile average station spacing). The majority of hypothetical DCFC stations are located on lower-traffic corridors for coverage purposes, some featuring plug requirements that are only 10% of the average station’s requirements (average station requiring 6 plugs to meet peak demand). Conversely, a minority of stations on very high traffic corridors are expected to require up to 450% as many plugs as the average station to adequately serve charging demand.
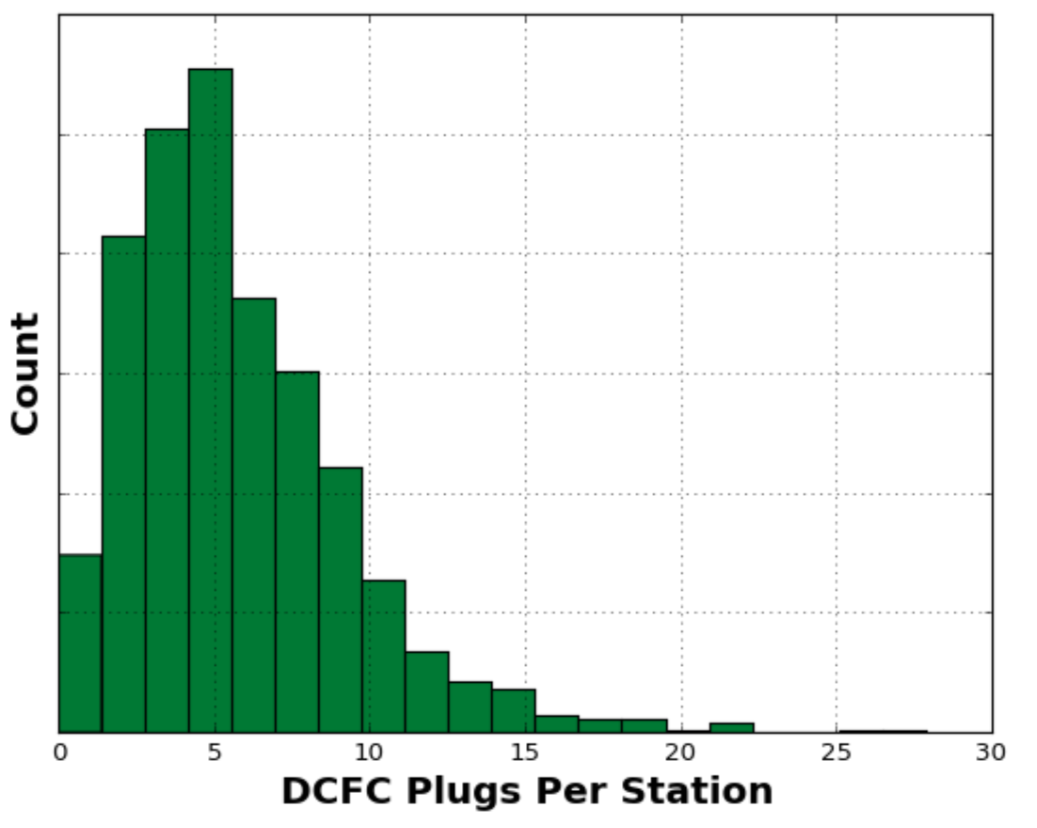 Figure 28. Plug requirement variance between stations.
Figure 29 puts the results in terms of total station counts and plug counts, and it shows the sensitivity of these counts to the corridor network selected, station spacing, BEV count, and charge time. The station counts chart (at left) illustrates the corridor coverage results from Table 9; because coverage requirements are independent of vehicle penetration, BEV count and charge time have no effect on them. In the plug counts chart (at right), the “network” bar multiplies the plugs per station results from Figure 27 by the mega-region, TAF, and full Interstate scenarios’ coverage requirements from Table 9. Assuming an average station spacing of 70 miles and 7 million BEVs, 822 plugs are required in the mega-region scenario, 1,494 in the TAF scenario, and 2,448 in the full Interstate scenario. The full Interstate network is used to explore the remaining sensitivities. National corridor DCFC station estimates range from 285 to 713 for average spacing values from 100 to 40 miles. Notably, national corridor DCFC plug count estimates show no sensitivity to average station spacing between 40 and 100 miles. While both station counts and plugs per station are sensitive to station spacing, they are inversely related (implying conservation of aggregate national demand) and result in no sensitivity between average station spacing and national corridor DCFC plug count estimates. The effect of the number of BEVs results in plug counts ranging from about 1,461 at 4 million BEVs to 3,419 at 10 million BEVs, under the central network scenario (full Interstate). Finally, charge time sensitivity was explored from 10 to 30 minutes, resulting in national plug counts from 1,236 to 3,709.
 Figure 29. Sensitivity of corridor DCFC station and plug counts to network, station spacing, BEV count, and charge time.
4.3 Challenges to Interstate Corridor Charging Infrastructure
The development of a comprehensive network of corridor DCFC stations presents several challenges, primarily related to sustainable business models, to address the substantial costs associated with deploying and operating a network of DCFC stations (Francfort et al. 2017, Svitak et al. 2017, Melaina et al. 2016, Alternative Energy Systems Consulting 2015) as well as minimizing the impact on the electric grid. Although there appears to be sufficient generation capacity to electrify the U.S. LDV fleet (Denholm and Short 2006, Duvall et al. 2007), large-scale PEV adoption and charging station installations might affect the electric infrastructure in several ways. Some of the long-term impacts are reduction in transformer life expectancy, accelerated wear and tear of feeder networks, power quality considerations, and capacity upgrades at the substation level to handle the incremental charging demand (Green et al. 2011). At the same time, the network of stations could represent a business opportunity for the electric industry, and smart charging could be used to optimize power demand in demand response programs where the DCFC stations vary the timing of their demand to reduce requirements on the electric power generation infrastructure (Muratori and Rizzoni 2016).
Moreover, two geographic challenges are associated with the development of a national network of DCFC stations: 1) availability of commercial land for siting DCFC stations, and 2) proximity of electric substations to the interstate corridor network. These are explored below in a limited geographic information system analysis.
4.3.1 Retail Land Use Availability
A publically available land use data set (Conservation Science Partners 2017) with a spatial resolution of 30 meters was used to identify all retail and commercial land parcels in the United States (Theobald 2014). A 1 km buffer on either side of the interstate corridor network served as a mask to clip the nationwide data set to the immediate vicinity of the highway network. The remaining adjacent retail land use polygons were then consolidated to generate potential candidate sites. The network distance between two potential consecutive sites was calculated by cutting the highway network into smaller segments linking candidate sites to each other, and measuring the length of resulting sub-segments.
Figure 30 shows the resulting national map with the Interstate network colored by the maximum spacing interval between consecutive parcels of commercial land use. Overall, it appears that the frequency of retail sites along the Interstate highway network would not be a significant obstacle to the installation of a national DCFC network along Interstate corridors. The average distance between consecutive parcels of commercial land use was 5.4 miles, and across the entire network of Interstate corridors only 0.8% features intervals between consecutive commercial land use types of over 50 miles.
 Figure 30. Distance between consecutive candidate retail sites.
(Satellite imagery credit: © 2017 Google, Map Data © 2017 Tele Atlas)
4.3.2 Existing Electrical Infrastructure: Proximity between Interstate Exits and Electrical Substations
In order to minimize the capital cost associated with corridor DCFC station installations, it is desirable to locate DCFC stations close to existing electrical substations. A spatial analysis was performed to combine an electrical substation data set to Interstate exits to measure relative proximity between the two. The substation data were extracted from ABB Energy Velocity Suite, ©2017. Results indicate the median distance between a highway exit and the closest electrical substation is 2.2 miles, while the average distance is 2.9 miles. Out of the 11,710 Interstate exits along the entire corridor highway network, only 3% are farther than 10 miles from the nearest electrical substation, 16% farther than 5 miles, and 35% farther than 3 miles. The map in Figure 31 shows that the majority of exits with poor proximity to electrical substations are located in the western part of the United States. Overall, it appears that the frequency of retail sites along the interstate highway network would not be a significant obstacle to the installation of a national DCFC network along interstate corridors.
 Figure 31. Highway exits color-coded by distance to the nearest electrical substation.
(Satellite imagery credit: © 2017 Google, Map Data © 2017 Tele Atlas)
4.4 Corridor Charging Support from Community-Based DCFC
As described above, the U.S. Interstate System provides a basis for DCFC infrastructure that can efficiently satisfy long-distance driving demands in the near term. The Interstate System is not, however, entirely isolated from community-based DCFC infrastructure. Although full community-based infrastructure may take longer to establish, it could provide travel corridors with charging backup options, route flexibility, and additional coverage along U.S. highways and state routes. Figure 34 shows the national DCFC station coverage enabled by providing the level of community-based charging station coverage quantified in Section 3. Each covered city and town has a 70-mile radius buffer around it, approximating station coverage.
 Figure 32. National charging station coverage enabled by providing minimum DCFC station coverage (70-mile buffers placed around all cities and towns).
(Satellite imagery credit: © 2017 Google, Map Data © 2017 Tele Atlas)