APPENDIX J – REQUIRED DELIVERY DATE (RDD) SIMULATION
In force projection operations, the RDD is a critical factor for commanders. The RDD is the date when commanders need their unit’s equipment in the theater of operation to effectively execute their missions. Should equipment not arrive by the RDD, commanders are forced to consider alternative options that may not prove advantageous for timely and effective mission accomplishment. During JV 3.0, cyber incidents caused both physical and electronic disruptions to commercial critical infrastructure required to ensure equipment meets the RDD suspense. The RDD simulation seeks to inform commanders about potential impacts to RDD when conducting force projection operations in a contested environment.
For the JV 3.0 scenario, a brigade-sized task force with approximately 2,300 pieces of equipment was tasked to deploy overseas in a Sealift Emergency Deployment Readiness Exercise. The hypothetical orders to initiate the exercise came on April 29, 2020 (turn 0), with an RDD of June 1, 2020. This simulation analyzes two potential alternatives after the events of turn 5 in JV 3.0. During this turn, the ports in both cities were forced to close due to cyber and physical issues. The various incidents that led to this closure included traffic congestion, protests, cyber incidents creating delays for both rail and line haul equipment, and the listing of a ship in port that resulted in the spillage of containers. Given these events, this simulation explores the number of days associated with two primary alternatives: waiting for the original port to remediate physical and cyber issues or relocating to a new port. The goal of the simulation is to generate a distribution that describes the number of days and to develop probabilities associated with the original RDD of June 1, 2020.
The simulation will take a standard Monte Carlo approach to estimate the total number of days it takes to execute key processes. The processes involved governing the options required to handle equipment stranded at the original port, equipment that was moving to the original port, and equipment that was yet to depart. Each of the key processes are represented with a triangle distribution whose parameters (minimum, maximum, and mean) were informed by data collected during the JV 3.0 events and from discussions with participants postevent. Table 10 provides brief descriptions of the various processes and their parameters used in the simulation.
Table 10: Key Processes and Their Parameters
The ACI looked at two options for each alternative. The process diagram for each alternative is shown in figure 38. For the alternative of remaining at the original port, there is a simulation that governs container spillage into the channel and an option that focuses only on remediating the various incidents, without including the spillage. In the case of relocating ports, the ACI presents the results of moving to ports both 200 and 1,000 miles from the point of departure. The following sections discuss the assumptions and results associated with each alternative.
 Figure 38: Process Diagrams for the Two Alternatives
J.1. Results: Remain at Original Port
For our first result, we look at staying with the original port, given the requirement to clear the channel. In this alternative, equipment that is at the port remains, and equipment moving to the port will have to return after traffic and protest issues have been resolved. We assume that movement to the port will not begin until the port is reopened, which includes establishing physical security, remediating malware, and clearing the channel. The remediation, reconfiguration, and movement for both rail and line haul occur in series, but are compared in parallel. We ran 10,000 simulations using 50 miles as the distance from point of origin to the port. In figure 39, a histogram of the results is shown on the left, and the minimum, maximum, and mean for each process is shown on the right.
 Figure 39: Original Port: Hold Movement until Port Has Been Fixed
Using the histogram, we can calculate the probability that the equipment will make RDD by summing up the number of simulations that occurred in less than or equal to 28 days (the number of days until June 1, 2020). In this case, there is a 23.4-percent chance that the equipment will make it by June 1, indicating that the scenario successfully disrupted force projection operations. Figure 39 illustrates that fixing the port (malware remediation and clearing the channel) is the most time-consuming process associated with this alternative.
Table 11 includes probabilities for additional days, indicating that it requires at least 40 days (arrival date of June 13, 2020) for a 95-percent probability.
Table 11: Fixing the Port: Travel Times and Associated Probabilities
Our second option for this alternative is to look at a situation in which there are no issues with the channel. In this case, we have removed a significant physical effect of the cyber intrusion to determine how much impact remediating the other intrusions (traffic lights, rail failure, and truck crash) will have on RDD. Using the same assumptions as before, we ran 10,000 simulations using 50 miles as the distance from point of origin to the port. Figure 40 shows a histogram of the results on the left and the minimum, maximum, and mean for each process on the right.
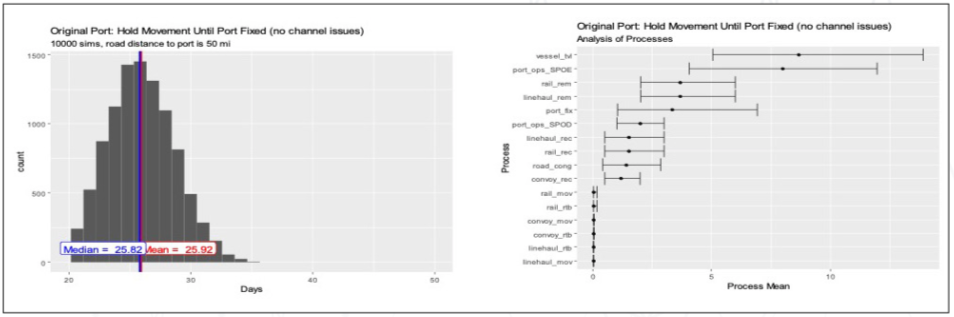 Figure 40: Original Port: Hold Movement until Port Has Been Fixed (No Channel Issues)
In this situation, we see there is a 77.25-percent chance that the equipment will make it by June 1, indicating that the scenario (minus channel issues) created some disruption to force projection operations. Table 12 provides probabilities for additional days, showing that the probability goes above 90 percent for 30 days.
Table 12: Fixing the Port (No Channel Issues): Travel Times and Associated Probabilities
In terms of the processes, we see that vessel travel and the port operations at the original port take the most time. The remediation of commercial assets (rail, line-haul, and port IT) follow as most timeconsuming and with the most variance.
J.2. Results: Shift to a New Port
This result looks at the alternative in which the commander chooses to shift ports. The first case considers the new port to be 200 miles away. For this alternative, we assume that the identification of a new port occurs first, followed by adjustment of the contracts for both rail and line haul (as well as convoy planning). Based on the parameters for the distributions, traffic congestion and return-tobase movement are dominated by replanning the new port and therefore are not considered. The remediation, replanning, reconfiguring, and movement for rail, line haul, and convoy occur in series. Finally, we assume that the equipment stranded at the original port will make it to the seaport of debarkation at the same time as or before the other equipment. Again, we ran 10,000 simulations and produced a graphic (figure 41) showing a histogram of the results on the left and analyses of the processes on the right.
 Figure 41: New Port: 200 Miles Away
For this alternative, there is a 1.28-percent chance that the equipment will make it by RDD, with over 95-percent probability of it occurring after 40 days (June 13). It follows that shifting to a port further away will reduce the probability; for a port 1,000 miles away (e.g., shifting from Charleston to Beaumont, Texas), there is a less-than-1-percent chance that the equipment will make RDD. Table 13 shows a breakdown of the probabilities by days for the port 200 miles away as well as the port 1,000 miles away.
Table 13: New Port: 200 Miles and 1,000 Miles Away – Travel Times and Associated Probabilities
Looking at the process analysis, replanning and reconfiguration dominate the time line, with reconfiguration taking a longer time than in option 1. Though the time for the movement processes increases and adds to the delay, the replanning and reconfiguration still take the longest after vessel movement and port operations.
J.3. Conclusions
Based on this simulation of the events occurring after turn 5, we find that cyber incidents do have an impact on force projection in a contested environment. Although the alternative that relied on the original port was preferable to the one that required changing ports, it still did not guarantee the equipment would make RDD. Yet, commanders should consider the significant time investment required for relocating to a different port and seek ways to improve the probabilities associated with the original port alternative. The conclusions from this simulation are as follows.
Proactive cybersecurity: The physical event resulting from the cyber incident created the most significant delay in the original port alternative. Stakeholders must remain proactive and identify potential threats early, before they fester.
United States Coast Guard (USCG): In the event of a deployment, SDDC and deploying units must ensure they notify the USCG unit responsible for the targeted port. The USCG cyber assets can assist in security, detection, and prevention.
Though shifting ports seems to be the least favorable option, if a spillage includes potentially hazardous materials, then the time required to clear the channel will increase. This information should be considered a commander’s critical information requirement.
Shifting ports may result in follow-on attacks, creating a cascading effect (recreating the situation at subsequent ports and adding to the delay).
J.4. Source Code
The source code used in this simulation is available by request to [email protected].
Table of Contents
- 1. FOREWORD
- 2. ACKNOWLEDGMENTS
- 3. INTRODUCTION - JACK VOLTAIC 3.0
- 4. JACK VOLTAIC RESEARCH METHODOLOGY
- 5. EXECUTION
- 6. FINDINGS
- 7. CONCLUSION
- APPENDIX A – ACRONYMS
- APPENDIX B – PARTNERS
- APPENDIX C – SCENARIO
- APPENDIX D – LAW/POLICY TABLETOP EXERCISE (TTX)
- APPENDIX E – LIVE-FIRE EXERCISE
- APPENDIX F – MILITARY TESTIMONIALS
- APPENDIX G – PRIVATE INDUSTRY TESTIMONIALS
- APPENDIX H – ALL HAZARDS ANALYSIS (AHA)
- APPENDIX I – CIRI FORT-TO-PORT DISRUPTION
- APPENDIX J – REQUIRED DELIVERY DATE (RDD) SIMULATION
- APPENDIX K – DSCA/DSCIR